Download
1 / 36
370 likes | 567 Views
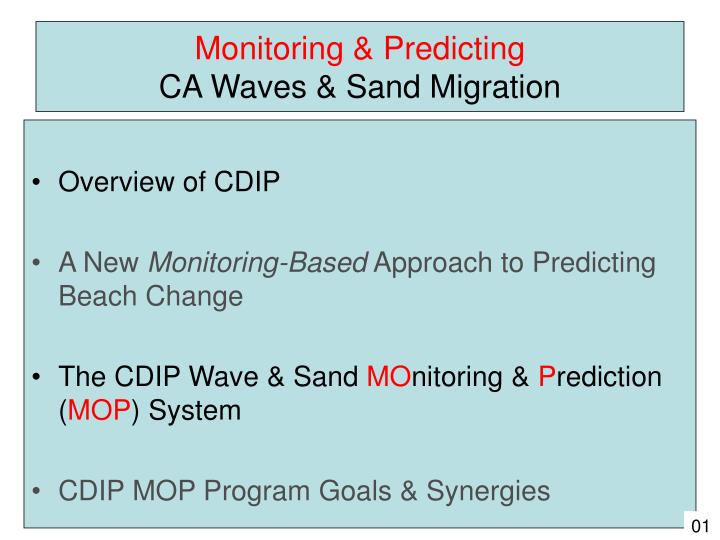
Monitoring & Predicting CA Waves & Sand Migration. Overview of CDIP A New Monitoring-Based Approach to Predicting Beach Change The CDIP Wave & Sand MO nitoring & P rediction ( MOP ) System CDIP MOP Program Goals & Synergies. 01. C OASTAL D ATA I NFORMATION P ROGRAM.

E N D
Monitoring & PredictingCA Waves & Sand Migration • Overview of CDIP • A New Monitoring-Based Approach to Predicting Beach Change • The CDIP Wave & Sand MOnitoring & Prediction (MOP) System • CDIP MOP Program Goals & Synergies 01
COASTALDATAINFORMATIONPROGRAM • Based at SIO since 1975. • 30+ Wave Stations • 170km Beach Monitoring (Mexican Border – Long Beach) • 14 People • $2.5M+ / year budget • Funded by: USACE CDBW CA CC ONR NSF NOAA BEACON CDIP Mission Monitor and Predict Coastal Waves and Beach Change 02
CDIP Wave Monitoring Datawell Directional Waverider 03
CDIP Waves & Sand SIO Waves & Beaches Observations Models Applications Waves: Directional Buoys Regional Wave Prediction Marine Navigation Islands Waves: Directional Buoys Waves: PUVs Nearshore Wave Prediction Beach Safety Coastal Engineering and Planning Shelf Waves: PUVs Sand: Jetski Surveys Surfzone Wave & Current Prediction Beach Safety (rips) Pathogen Transport (beach closures) Inundation Surf Sand: ATV Surveys Sand: LIDAR Surveys Sediment Transport Prediction RSM (Coastal Evolution w/ Climate Change) Beach 05
CDIP Waves & Sand Observations Models Applications Waves: Directional Buoys Regional Wave Prediction Marine Navigation Islands Waves: Directional Buoys Waves: PUVs Nearshore Wave Prediction Beach Safety Coastal Engineering and Planning Shelf Waves: PUVs Sand: Jetski Surveys Surfzone Wave & Current Prediction Beach Safety (rips) Pathogen Transport (beach closures) Inundation Surf Sand: ATV Surveys Sand: LIDAR Surveys Sediment Transport Prediction RSM (Coastal Evolution w/ Climate Change) Beach Information Flow 06
Port of Los Angeles/Long Beach –Customized Website integrates CDIP Waves and SCCOOS HF Radar Surface Currents • Currents • -Surface (6km) • Waves • -San Pedro Buoy • -Prediction Points • -Swell Model • NOAA Charts • Shipping Lanes Wave Forecast http://sccoos.ucsd.edu/themes/harbors 08
CDIP Waves & Sand Observations Models Applications Waves: Directional Buoys Regional Wave Prediction Marine Navigation Islands Waves: Directional Buoys Waves: PUVs Nearshore Wave Prediction Beach Safety Coastal Engineering and Planning Shelf Waves: PUVs Sand: Jetski Surveys Surfzone Wave & Current Prediction Beach Safety (rips) Pathogen Transport (beach closures) Inundation Surf Sand: ATV Surveys Sand: LIDAR Surveys Sediment Transport Prediction RSM (Coastal Evolution w/ Climate Change) Beach Information Flow 09
Monitoring-Based Nearshore Sea & Swell Predictions Huntington Beach Wave Buoy Distant Swells Local Seas 10
CDIP Waves & Sand Observations Models Applications Waves: Directional Buoys Regional Wave Prediction Marine Navigation Islands Waves: Directional Buoys Waves: PUVs Nearshore Wave Prediction Beach Safety Coastal Engineering and Planning Shelf Waves: PUVs Sand: Jetski Surveys Surfzone Wave & Current Prediction Beach Safety (rips) Pathogen Transport (beach closures) Inundation Surf Sand: ATV Surveys Sand: LIDAR Surveys Sediment Transport Prediction RSM (Coastal Evolution w/ Climate Change) Beach Information Flow 12
Huntington State Beach 2006 Nearshore Circulation Experiment Huntington Beach Pier West Swell Santa Ana River Alongshore Current ? Local Seas South Swell 13
Huntington State Beach Mean Alongshore Current Prediction Sep-Oct 2006 Northward Current Southward Current Flow Reversal 14
CDIP Waves & Sand Observations Models Applications Waves: Directional Buoys Regional Wave Prediction Marine Navigation Islands Waves: Directional Buoys Waves: PUVs Nearshore Wave Prediction Beach Safety Coastal Engineering and Planning Shelf Waves & Currents: PUVs Sand: Jetski Surveys Surfzone Wave & Current Prediction Beach Safety (rips) Pathogen Transport (beach closures) Inundation Surf Sand: ATV Surveys Sand: LIDAR Surveys Sediment Transport Prediction RSM (Coastal Evolution w/ Climate Change) Beach Information Flow 15
6 Years of Concurrent Wave & Sand Monitoring Preliminary Findings • Beach response to waves varies • greatly throughout the SCBPS • region. • How a specific beach responds • to waves can be surprisingly • well predicted by simple models • “tuned” with detailed monitoring • data. • Numerous wave-driven subcells • exist within the Oceanside littoral • cell. 17
Oceanside Littoral Cell: The “River of Sand” Wave-Driven Net Southward Sand Transport Sand Leaves Cell at Scripps Submarine Canyon 19
Wave Climate : Oceanside Littoral Cell Alongshore Wave Climate Reconstruction Cross-shore Component Incident waves Alongshore Component CDIP Buoys 20
Wave-driven Lagoon Sub-Cells Batiquitos Sub-Cell Moonlight Sub-Cell San Elijo Sub-Cell Fletcher Sub-Cell San Diegito Sub-Cell Penesquitos Sub-Cell Torrey Pines Sub-Cell 21
COASTAL LAGOON LITTORAL SUB-CELLS Coastal Lagoon Sand Borrow Sites Potential downcoast sand transport increases between Lagoons. Naturally sand-deprived section of coast along base of cliffs between Lagoons. Ocean less sand 20m depth contour Wave-driven transport slows near lagoon entrance 10m Coastal Lagoon Ocean Ocean Natural Wave Erosion Hot Spot. + Net Offshore Sand Transport 0 Net Alongshore Transport more sand Sand Borrow Sites 22
CDIP Waves and Sand MOnitoring & Prediction (MOP) System Public Access To Core Coastal Environment Variables Via “MOP Sites” • Coastal Wave Modeling • Breaking wave heights • Radiation stresses (Sxx,Sxy) • Wave Monitoring • Wave Buoy Network • NOAA WW3 Forecasts • Surfzone Monitoring • Current Measurements • Dye/Drifter Tracking • Jetski Sand level Surveys • Surfzone Modeling • Current Direction & Speed • Bottom Velocities • Beach Monitoring • LIDAR • ATV Sand level surveys • Beach Modeling • Beach width change • Inundation levels 23
The CA coastline is divided into a contiguous set of MOP Polygons. Polygon IDentifier based on County 24
Each MOP Transectis bounded by a MOP Nearshore Site and a MOP Backbeach Site. Nearshore Site (10m Depth) Backbeach Site ~100m alongshore spacing 26
CA Counties with Operational MOP Wave Information 28
MOP Alongshore Currents Predicted surfzone averaged alongshore currents are provided at each transect on a relatively straight beach without obstructions. A seasonal cross-shore bathymetry profile is assumed if there is no recent survey data. 29
MOP Coastal Inundation Known elevation that results in parking lot flooding at this location Predicted Inundation Elevations will be provided for transects with simple shoreline profiles 30
Each MOP Polygonwill contain a set of MOP Sandboxes. NEXT: MOPS & RSM 32
MOP Program Goals • Sustainable State-wide Monitoring and Prediction of Coastal Waves & Sand Migration. • Expanded support of fundamental research using MOP monitoring data. • Formal and Routine communication with coastal engineers and decision-makers. 33
MOPping UP • 2 Years of seed money from CDBW San Diego County MOP-RSM Demonstration Project • New Cooperative Agreement with USGS Southern California Coastal Hazards Project 34
MOP-RSM Synergies • MONITORING : USGS & NPS : Nearshore Sand Survey Teams • PREDICTION : MOP-RSM Climate Change Initiatives? • POLICY CALOST : science-to-policy success story? OPC: Tri-State Collaboration? 35
Tri-StateCollaboration WA, OR, CA CDIP has wave buoys at the entrance to all the major west coast ports except the Columbia River/Portland Gray’s Harbor • USACE • dredging and shoreline management • NOAA & NWS • website dissemination • marine broadcast on NOAA weather channel • USGS & Dept. of Ecology (WA) • shoreline change and erosion • Maritime Transportation • interstate commerce • Ocean Observing Systems • SCCOOS, CENCOOS, NANOOS Coos Bay Humboldt Bay San Francisco Port Hueneme LA/LB San Diego 36