Download
1 / 8
80 likes | 185 Views
Total Rides Given by Weekend. To the right is a graphic representation of the total number of SafeRides given over the course of 4 weekends. It is not broken down by apartment complex, it is simply a total of each weekend. Total Rides Given.

E N D
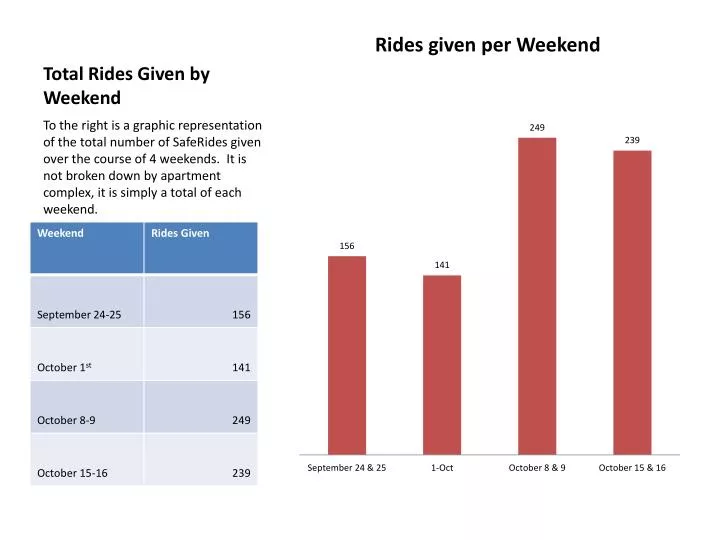
Total Rides Given by Weekend To the right is a graphic representation of the total number of SafeRides given over the course of 4 weekends. It is not broken down by apartment complex, it is simply a total of each weekend.
Total Rides Given To the right is a graphic representation of the total number of SafeRides given over the course of 4 weekends. On the weekend of October 1st, only rides given on Friday, the 1st, were recorded.
Overall Usage To the right is a graph representing the usage of SafeRides. 93 non members were polled and asked if they had ever used the service.
Overall Satisfaction To the right is a graph displaying the satisfaction with the SafeRides service on a scale of 1-10. The graph is a display of the viewers that have used SafeRides before.
Weekend 1 To the right is a graphic representation of the total number of SafeRides given over the weekend of September 24th, including both Friday the 24th and Saturday the 25th.
Weekend 2 To the right is a graphic representation of the total number of SafeRides given Friday October 1st.
Weekend 3 To the right is a graphic representation of the total number of SafeRides given over the weekend of October 8th, including both Friday the 8th and Saturday the 9th.
Weekend 4 To the right is a graphic representation of the total number of SafeRides given over the weekend of October 15th, including both Friday the 15th and Saturday the 16th