Download
1 / 23
230 likes | 343 Views
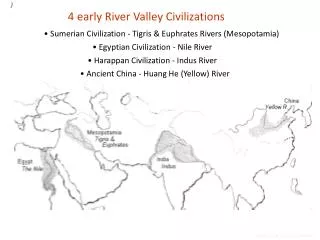
The influence of movement dynamics on ecosystem structure: Suckers as ecosystem engineers. Michael T. Booth, Alex S. Flecker, Nelson G. Hairston, Jr. Dept. of Ecology and Evolutionary Biology, Cornell University. 1 m. 0.2 m. 1 m. West Fork Gila River. Middle Fork Gila. West Fork Gila.

E N D
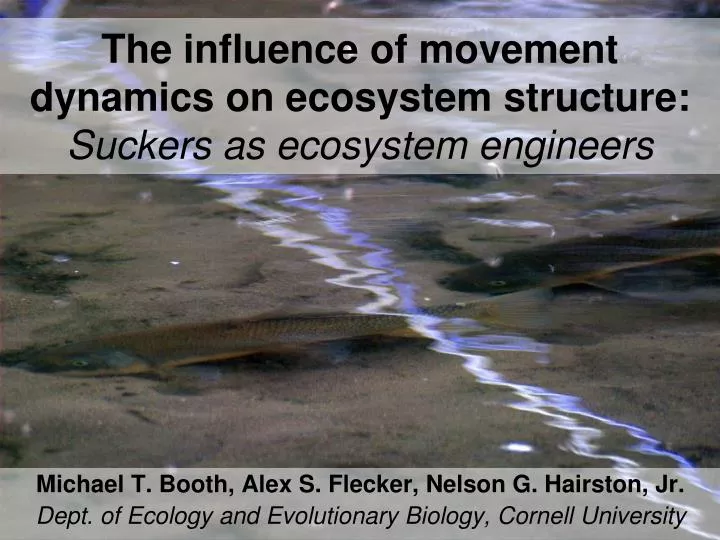
The influence of movement dynamics on ecosystem structure: Suckers as ecosystem engineers Michael T. Booth, Alex S. Flecker, Nelson G. Hairston, Jr. Dept. of Ecology and Evolutionary Biology, Cornell University
0.2 m 1 m
West Fork Gila River Middle Fork Gila West Fork Gila Focal reach Fish “refuge” sites
A1 A4 A3 A2 Fish movement and habitat use • 23mm 134.2 kHz PIT tags, detection range 0.3-0.8 m, >500 tagged fish (180-500mm SL) in 2 km reach in 2008, 2009 • 8multiplexed stationary antennas (8.5-13 m wide, 2.3 scans/sec) • Weekly scans of refuge habitats over 4 km reach with portable antenna
Fish movement and habitat use Full reach (2 km) Frequency transect (inset) #3 Diel sampling site
Hourly fish activity Day Night Day
<20 cm visibility flood Typical fish activity
Suckers as ecosystem engineers Transient effects
Downstream fluxes • 5 diel sampling events at focal pool, 2 events included other pools • Collected seston samples at 10 time points (2-3 hr intervals)
Diel seston concentrations Seston dry mass (3 replicates per time point) Fish activity within focal reach 0.025 0.020 0.015 Dry Mass (g/L) 0.010 0.005 0.000 6/29 06:30 6/29 09:30 6/28 09:30 6/28 12:30 6/28 15:30 6/28 18:30 6/28 20:30 6/28 22:30 6/29 01:30 6/29 04:30
Suckers as ecosystem engineers Long lived effects
Methods: “Feeding” transects • 2 transects per “divotable” habitat over 2 km reach (≈30% area, silt/sand/gravel) • 2-4 quadrats per transect, measured width and depth of 4 representative divots per quadrat, 5 dates 0.5 m
flow Distribution of depressions 6/23/09
Frequency transects • 5 transects (7-14 m, 8-11 quadrats) • 0.25 m2 quadrats, 5 numbered and bi-colored washers • Scored daily or AM/PM (gravel/sand, moved, flipped, divot), 20 pts possible
#1 Frequency transects #3 0 4 6 Stationary antenna reach Quadrat scores #6 #9 Sites >10 suckers Reach length: 2 km #10
Frequency transects Date Quadrat location Relative disturbance
Quadrat location Quadrat location Quadrat location Flood
From diel to seasonal, baseflow to flood event UNDERSTANDING MOVEMENT PATTERNS
“Fine scale” movements 2009 data only shown, but including fish from both years
05/24/2009 06/21/2009 07/19/2009 05/24/2009 06/21/2009 07/19/2009 05/24/2009 06/21/2009 07/19/2009 date date date 05/24/2009 06/21/2009 07/19/2009 05/24/2009 06/21/2009 07/19/2009 05/24/2009 06/21/2009 07/19/2009 date date date “Large scale” movements of individual fish -3000 -3000 -3500 -3500 -4000 -4000 -4500 -4500 -5000 -5000 Location Location -5500 -5500 -6000 -6000 -6500 -6500 -7000 -7000 2009 data only shown, but including fish from both years