Download
1 / 35
350 likes | 462 Views
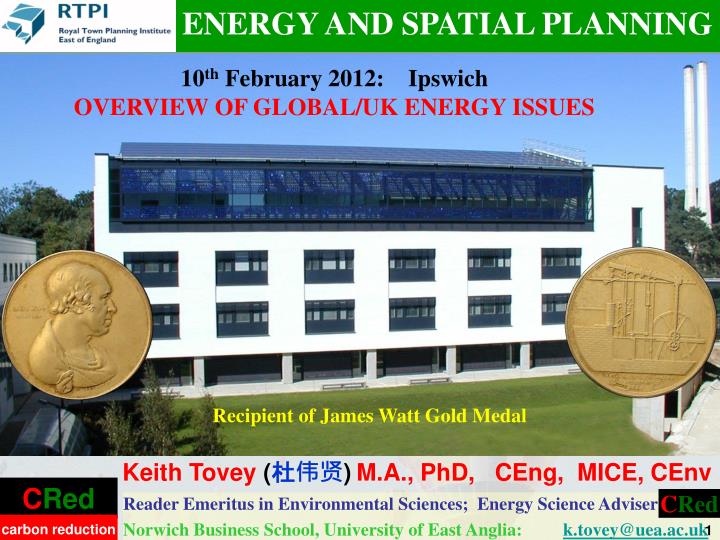
ENERGY AND SPATIAL PLANNING. 10 th February 2012: Ipswich OVERVIEW OF GLOBAL/UK ENERGY ISSUES. Recipient of James Watt Gold Medal. Keith Tovey ( 杜伟贤 ) M.A., PhD, CEng, MICE, CEnv. C Red. Reader Emeritus in Environmental Sciences; Energy Science Adviser

E N D
ENERGY AND SPATIAL PLANNING 10th February 2012: Ipswich OVERVIEW OF GLOBAL/UK ENERGY ISSUES Recipient of James Watt Gold Medal Keith Tovey (杜伟贤)M.A., PhD, CEng, MICE, CEnv CRed Reader Emeritus in Environmental Sciences; Energy Science Adviser Norwich Business School, University of East Anglia: k.tovey@uea.ac.uk
Overview of Presentation • Overview of the Three Challenges facing the UK Energy scene. Carbon Reduction, Energy Security and Cost of our Future Energy Supplies • Options for Electricity generation • The Challenges for 2020 • Some challenges and opportunities for renewable energy and energy conservation • These complement the critically important aspect of addressing Energy Management and Awareness Issues • Conclusions 2
The Triple Challenges of Carbon Reduction, Energy Security and Cost of our Future Energy Supplies Businesses and Individuals are faced with three challenges associated with Energy Use: • Increasing Evidence of Anthropogenic Climate Change – and consequential legislation • Issues of Energy Security – particularly in UK • The need to minimise cost exposures to price fluctuations in Energy These Challenges can be addressed by: • Moving to Low Carbon Energy Supply • Employing Technical Solutions to improve efficiency of End-Use Energy. • Promoting Effective Energy Management and Awareness among users.
Energy Security is a potentially critical issue for the UK Import Gap Gas Production and Demand in UK On 7th/8th December 2010: UK Production was only 39%: 12% from storage and 49% from imports Prices have become much more volatile since UK is no longer self sufficient in gas.
Variation in Wholesale and Retail Electriity Prices In Real Terms, Domestic Electricity Prices have only recently returned to 1981 levels STOP PRESS 6th Feb 2012 08:42 GMT Gazprom Expects Gap Between EU Gas Requests this week By Anna Shiryaevskaya Russia’s natural-gas export monopoly, said it expects a gap between requests from European customers and the amount it can supply during the cold snap. Gazprom is supplying at the maximum capacity. In recent years, electricity retail prices have varied much less than wholesale prices and have also risen less. 5
What is the magnitude of the CO2 problem? How does UK compare with other countries? Why do some countries emit more CO2 than others? France UK Per capita Carbon Emissions 6
Carbon Emissions and Electricity UK France • Coal ~ 900 - 1000 g / kWh • Oil ~ 800 – 900 g/kWh • Gas (CCGT) ~ 400 - 430 kg/kWh • Nuclear ~ 5 – 20 g/kWh 7 Current UK mix ~ 530 g/kWh
Options for Electricity Generation in 2020 - Non-Renewable Methods Nuclear New Build assumes one new station is completed each year after 2020. ? Carbon sequestration either by burying it or using methanolisation to create a new transport fuel will not be available at scale required until mid 2020s so cannot help short term. * Energy Review 2011 – Climate Change Committee May 2009 9
Options for Electricity Generation in 2020 - Renewable 1.5MW Turbine At peak output provides sufficient electricity for 3000 homes On average has provided electricity for 700 – 850 homes depending on year Future prices from * Renewable Energy Review – 9th May 2011 Climate Change Committee
Options for Electricity Generation in 2020 - Renewable Climate Change Committee (9th May 2011) see offshore wind as being very expensive and recommends reducing planned expansion by 3 GW and increasing onshore wind by same amount Scroby Sands has a Load factor of 28.8% - 30% but nevertheless produced sufficient electricity on average for 2/3rds of demand of houses in Norwich. At Peak time sufficient for all houses in Norwich and Ipswich
Options for Electricity Generation in 2020 - Renewable Micro Hydro Scheme operating on Siphon Principle installed at Itteringham Mill, Norfolk. Rated capacity 5.5 kW Future prices from Climate Change Report (May 2011) or RO/FITs where not otherwise specified
Options for Electricity Generation in 2020 - Renewable Climate Change Report suggests that 1.6 TWh (0.4%) might be achieved by 2020 which is equivalent to ~ 2.0 GW. Future prices from Climate Change Report (May 2011) or RO/FITs where not otherwise specified
Options for Electricity Generation in 2020 - Renewable • Transport Fuels: • Biodiesel? Bioethanol? • Compressed gas from methane from waste. To provide 5% of UK electricity needs will require an area the size of Norfolk and Suffolk devoted solely to biomass Future prices from Climate Change Report (May 2011) or RO/FITs where not otherwise specified
Options for Electricity Generation in 2020 - Renewable Future prices from Climate Change Report (May 2011) or RO/FITs where not otherwise specified
Options for Electricity Generation in 2020 - Renewable Future prices from Climate Change Report (May 2011) or RO/FITs where not otherwise specified
Options for Electricity Generation in 2020 - Renewable Severn Barrage/ Mersey Barrages have been considered frequently e.g. pre war – 1970s, 2009 Severn Barrage could provide 5-8% of UK electricity needs In Orkney – Churchill Barriers Output ~80 000 GWh per annum - Sufficient for 13500 houses in Orkney but there are only 4000 in Orkney. Controversy in bringing cables south. Would save 40000 tonnes of CO2 Future prices from Climate Change Report (May 2011) or RO/FITs where not otherwise specified
Options for Electricity Generation in 2020 - Renewable Future prices from Climate Change Report (May 2011) or RO/FITs where not otherwise specified
Options for Electricity Generation in 2020 - Renewable Demonstrates importance of on shore wind for next decade or so Future prices from Climate Change Report (May 2011) or RO/FITs where not otherwise specified
Our looming over-dependence on gas for electricity generation • 1 new nuclear station completed each year after 2020. • 1 new coal station fitted with CCS each year after 2020 • 1 million homes fitted with PV each year from 2020 - 40% of homes fitted by 2030 • 19 GW of onshore wind by 2030 cf 4 GW now Imported Gas UK Gas Offshore Wind Onshore Wind Oil Other Renewables Existing Coal New Coal New Nuclear Existing Nuclear Data for modelling derived from DECC & Climate Change Committee (2011) - allowing for significant deployment of electric vehicles and heat pumps by 2030.
Our Choices: They are difficult • Do we want to exploit available renewables i.e onshore/offshore wind and biomass?. • Photovoltaics, tidal, wave are not options for next 10 - 20 years. • [very expensive or technically immature or both] • If our answer is NO • Do we want to see a renewal of nuclear power ? • Are we happy with this and the other attendant risks? • If our answer is NO • Do we want to return to using coal? • then carbon dioxide emissions will rise significantly • unless we can develop carbon sequestration within 10 years UNLIKELY – confirmed by Climate Change Committee • [9th May 2011] If our answer to coal is NO Do we want to leave things are they are and see continued exploitation of gas for both heating and electricity generation? >>>>>>
Our Choices: They are difficult • If our answer is YES • By 2020 • we will be dependent on GAS • for around 70% of our heating and electricity • imported from countries like Russia, Iran, Iraq, Libya, Algeria • Are we happy with this prospect? >>>>>> • If not: • We need even more substantial cuts in energy use. • Or are we prepared to sacrifice our future to effects of Global Warming? - the North Norfolk Coal Field? Do we wish to reconsider our stance on renewables? Inaction or delays in decision making will lead us down the GAS option route and all the attendant Security issues that raises. We must take a coherent integrated approach in our decision making – not merely be against one technology or another
Sustainable Options for the future? Solar Collectors installed 27th January 2004 Annual Solar Gain 826 kWh Members of community agreed to purchase Solar Panels at same time. Significantly reduced costs
Sustainable Options for the future? • Energy Generation • Solar thermal - providing hot water - most suitable for domestic installations, hotels – generally lees suitable for other businesses • Solar PV – providing electricity - suitable for all sizes of installation • Example 2 panel ( 2.6 sqm ) in Norwich – generates 826kWh/year (average over 7 years). • The more hot water you use the more solar heat you get! • Renewable Heat Incentive available from 2012 • Area required for 1 kW peak varies from ~ 5.5 to 8.5 sqm depending on technology and manufacturer • Approximate annual estimate of generation • = installed capacity * 8760 * 0.095 hours in year load/capacity factor of 9.5%
The Behavioural Dimension: Awareness raising Social Attitudes towards energy consumption have a profound effect on actual consumption Data collected from 114 houses in Norwich between mid November 2006 and mid March 2007 For a given size of household electricity consumption for appliances [NOT HEATING or HOT WATER] can vary by as much as 9 times. When income levels are accounted for, variation is still 6 times 25
Performance of ZICER Building 800 350 Good Management has reduced Energy Requirements Space Heating Consumption reduced by 57% CO2 emissions reduced by 17.5 tonnes per annum. 26 26
Electricity Consumption in an Office Building in East Anglia Low Energy Lighting Installed • Consumption rose to nearly double level of early 2005. • Malfunction of Air-conditioning plant. • Extra fuel cost £12 000 per annum ~£1000 to repair fault • Additional CO2 emitted ~ 100 tonnes.
Average Domestic Electricity Consumption in Norfolk and Suffolk • % of average cost of electricity bills compared to National Average • Rank position in UK out of 408 Local Authorities Average house in Norwich emits 1.87 tonnes of CO2 from electricity consumption in Kings Lynn 3.04 tonnes of CO2 (based on UK emission factors) Average household electricity bill in Norwich is 64% that in Kings Lynn 28
Impact of Electricity Generation on Carbon Emissions. • In 2009 Norfolk and Suffolk was a very low carbon zone in UK • But current accounting procedures do not allow regions to promote this. • A firm in Norfolk / Suffolk would have only 16% of carbon emissions from electricity consumption Approximate Carbon Emission factors during electricity generation including fuel extraction, fabrication and transport. 29
Electricity Supply in Norfolk and Suffolk (GWh) Existing Renewables • Total generation in Norfolk and Suffolk (allowing for losses) ~ 11000 GWh • Total demand in Norfolk and Suffolk • = 7803 GWh • Net export to remainder of UK ~ 3200 GWh Great Yarmouth Sizewell B At £12.50 per tonne (current EU-ETS price), this represents a benefit of £18 million to rest of UK in carbon saved. • 2009 Data for Renewables and Sizewell –before new offshore wind farms came on line • Other Data based on typical load factors Export of Electricity to rest of UK 30
How Variable is Wind Energy? Data from BMREPORTS for 2010 Changes in output over 30 minute period Wind Max: 914 MW Min: – 1051 MW StDev : 37.8 MW Nuclear Max: 1630 MW Min: - 877 MW StDev: 39.9MW Data for Sun/Mon 25/26 Sep 2011 31
How Variable is Wind Energy? 70% of Wind Output is now Visible to National Grid Predictions are made 2 days and 1 day in advance and demonstrate a correlation comparable with the prediction of demand variations. Prediction made mid-afternoon for next 48 hours Prediction made 1 day later and typically for output 24 hours in advance Actual Output in last week of January 2012
Seeking Effective Low Carbon Solutions for Energy Supply Small scale solar PV under the Feed in Tariff (@43.3p/kWh) ~ £700+ per tonne CO2 saved Large Scale On-shore wind under Renewable obligation ~ £90+ per tonne CO2 saved 713 7000 MWh on shore wind generated at an extra cost of £265.4M Total generated = 361 110 000 MWh: Effective subsidy = 0.07p / kWh ~ 0.6% on domestic bills or ~2% with all renewables considered Compared to rises of 20%+ mostly from increases in fossil fuels Subsidy for onshore wind is being cut by 10% in near future Cavity Insulation ~ <<£20 per tonne CO2 saved There will be an increased demand for electricity in a future which promotes conservation of energy! - heat pumps – electric vehicles Effective Energy Management can often be cost negative in terms of CO2 saved. An effective strategy will focus on most cost effective solutions both in the short term and long term. Data from Digest of UK Energy Statistics 2011 33
Conclusions: A Strategy for Future Sustainable Energy Supply • Will require: • Effective Awareness and Energy Management; • Improved Technology to make better use of existing energy; • Low Carbon Energy Supply – including: • Cost effective and technically mature renewables • Nuclear (?) • Carbon Capture and Sequestration – but this will not be available until mid 2020s on scale required if then. • Only On Shore Wind (??? Some biomass) will be most cost effective solutions for renewable energy until at least 2020 • Large Scale Wind is often meeting stiff opposition from planning issues – many of which are red-herrings • Innovative solutions for financing e.g. The ESCO approach and objective and fair approaches towards planning issues are needed for an effective way forward.
ENERGY AND SPATIAL PLANNING Finally! LaoTzu (604-531 BC) Chinese Artist and Taoist philosopher "If you do not change direction, you may end up where you are heading." A copy of this presentation will appear at the following WEBSITE http://www.cred-uk.org follow Academic Resources Link k.tovey@uea.ac.uk