Download
1 / 15
170 likes | 375 Views
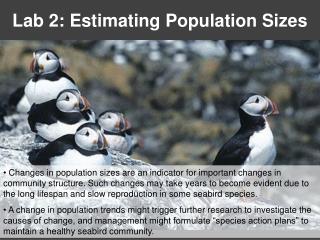
Lab 7. Estimating Population Structure. Goals. Estimate and interpret statistics (AMOVA + Bayesian) that characterize population structure. Demonstrate roles of gene flow and genetic drift on population structure. q m. m. m. m. m. m. q 0. q 0. q 0. q 0. q 0.

E N D
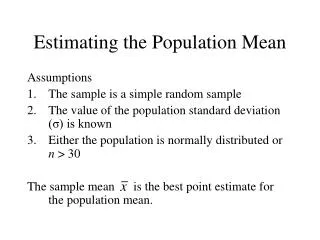
Goals • Estimate and interpret statistics (AMOVA + Bayesian)that characterize population structure. • Demonstrate roles of gene flow and genetic drift on population structure.
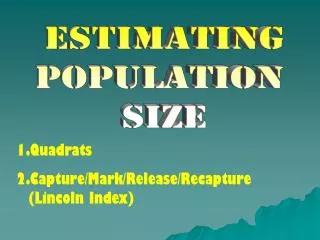
qm m m m m m q0 q0 q0 q0 q0 Gene flow and Genetic drift Gene flow maintains similar allele frequency in different subpopulations. Genetic driftcauses random differences in allele frequencies among small subpopulations. Wright’s Island model:Assumes Gene flow occurs with equal probability from the continent (large source population) to each island (smaller subpopulations)
Gene flow and Genetic drift Assuming equilibrium between gene flow (increasing variations) and genetic drift (reducing variation in finite population) and also assuming Wright’s island model, diversity among subpopulations(FST) can be calculated as : If, m=0, FST =1; i.e. Strong genetic differentiation exists among subpopulations. If, m=1, FST =0; i.e. No genetic differentiation exists among subpopulations.
Population structure from worldwide human population Population = subpopulation. Group = Regions Eurasia East Asia Oceania America Africa
AMOVA result interpretations: -------------------------------------------------------------------------------------------------------------- Source of variations Percentage of variation -------------------------------------------------------------------------------------------------------------- Among groups(regions) 10 Among sub(populations) within a region 4 Within sub(populations) 86 Fixation Indices: FST : 0.14 FSC : 0.04 FCT : 0.10 ---------------------------------------------------------------------- 14 % of total genetic variation is due to differentiation among subpopulations. 86 % of total genetic variation is due to differentiation within subpopulations. 4 % of regional genetic variation is due to differentiation among subpopulations. 10 % of total genetic variation is due to differentiation among regions.
# of individuals # of pops. # individuals in regions # of regions # individuals in pops.
Problem 1. File human_struc.xls contains data for 10 microsatellite loci used to genotype 41 human populations from a worldwide sample.a.) Convert the file into Arlequin format and perform AMOVA based on this grouping of populations within regions using distance measures based on the IAM and the SMM. How do you interpret these results? Report values of the phi-statistics and their statistical significance for each AMOVA you run. b.) Do you think that any of these regions can justifiably be divided into subregions? Pick a region, form a hypothesis for what would be a reasonable grouping of populations into subregions, then run AMOVA only for the region you selected using distance measures based on both the IAM and the SMM. Was your hypothesis supported by the data? c.) How do the phi-statistics calculated from distance measures based on the SMM compare to those based on the IAM? d.) GRADUATE STUDENTS: Which of the 5 initially defined regions has the highest diversity in terms of effective number of alleles? What is your biological explanation for this?
Problem 2. Use Structure to further test the hypotheses you developed in Problem 1.a.) Calculate the posterior probabilities to test whether: i. All populations form a single genetically homogeneous group. ii. There are two genetically distinct groups within your selected region iii. There are three genetically distinct groups within your selected region. b.) Use the ΔK method to determine the most likely number of groups. How does this compare to the method based on posterior probabilities? c.) How do the groupings of subpopulations compare to your expectations from Problem 1? d.) Is there evidence of admixture among the groups? If so, include a table or figure showing the proportion of each subpopulation assigned to each group. e.) GRADUATE STUDENTS: Provide a brief, literature-based explanation for the groupings you observe.