Download
1 / 105
1.07k likes | 1.4k Views
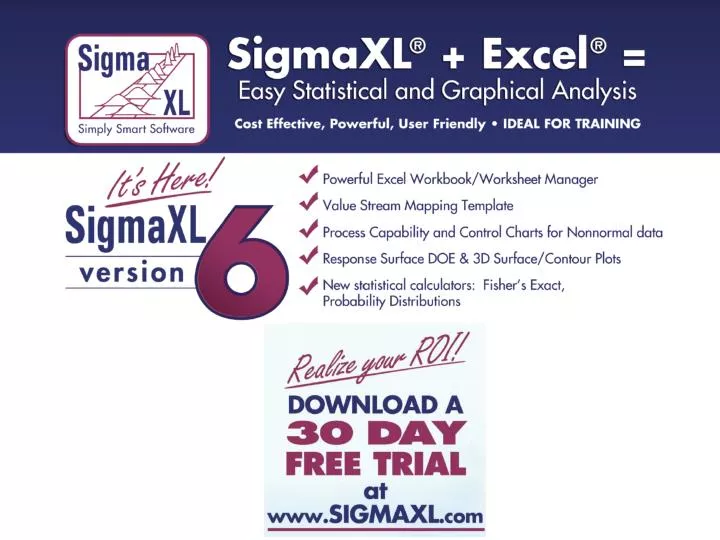
Introducing SigmaXL ® Version 6. Powerful. User-Friendly. Cost-Effective. Priced at $249, SigmaXL is a fraction of the cost of any major statistical product, yet it has all the functionality most professionals need. Quantity, Educational, and Training discounts are available.

E N D
Introducing SigmaXL® Version 6 • Powerful. • User-Friendly. • Cost-Effective. Priced at $249, SigmaXL is a fraction of the cost of any major statistical product, yet it has all the functionality most professionals need. • Quantity, Educational, and Training discounts are available. • Visit www.SigmaXL.com or call 1-888-SigmaXL (1-888-744-6295) for more information.
Why SigmaXL? • Measure, Analyze, and Control your Manufacturing, Service, or Transactional Process. • An add-in to the already familiar Microsoft Excel, making it a great tool for Lean Six Sigma training. Used by Motorola University and other leading consultants. • SigmaXL is rapidly becoming the tool of choice for Quality and Business Professionals.
What’s Unique to SigmaXL? • User-friendly Design of Experiments with “view power analysis as you design”. • Measurement Systems Analysis with Confidence Intervals. • Two-sample comparison test - automatically tests for normality, equal variance, means, and medians, and provides a rules-based yellow highlight to aid the user in interpretation of the output. • Low p-values are highlighted in red indicating that results are significant.
What’s Unique to SigmaXL? • Powerful Excel Worksheet Manager • List all open Excel workbooks • Display all worksheets and chart sheets in selected workbook • Quickly select worksheet or chart sheet of interest • Process Capability and Control Charts for Nonnormal data • Best fit automatically selects the best distribution or transformation! • Nonnormal Process Capability Indices include Pp, Ppk, Cp, and Cpk • Box-Cox Transformation with Threshold so that data with zero or negative values can be transformed!
Recall Last Dialog • Recall SigmaXL Dialog • This will activate the last data worksheet and recall the last dialog, making it very easy to do repetitive analysis. • Activate Last Worksheet • This will activate the last data worksheet used without recalling the dialog.
Worksheet Manager • List all open Excel workbooks • Display all worksheets and chart sheets in selected workbook • Quickly select worksheet or chart sheet of interest
Recall Last Dialog • Recall SigmaXL Dialog • This will activate the last data worksheet and recall the last dialog, making it very easy to do repetitive analysis. • Activate Last Worksheet • This will activate the last data worksheet used without recalling the dialog.
Data Manipulation • Subset by Category, Number, or Date • Random Subset • Stack and Unstack Columns • Stack Subgroups Across Rows • Standardize Data • Random Number Generators • Normal, Uniform (Continuous & Integer), Lognormal, Exponential, Weibull and Triangular. • Box-Cox Transformation
Templates & Calculators • DMAIC & DFSS Templates: • Team/Project Charter • SIPOC Diagram • Flowchart Toolbar • Data Measurement Plan • Cause & Effect (Fishbone) Diagram and Quick Template • Cause & Effect (XY) Matrix • Failure Mode & Effects Analysis (FMEA) • Quality Function Deployment (QFD) • Pugh Concept Selection Matrix • Control Plan
Templates & Calculators • Lean Templates: • Takt Time Calculator • Value Analysis/Process Load Balance • Value Stream Mapping • Basic Graphical Templates: • Pareto Chart • Histogram • Run Chart
Templates & Calculators • Basic Statistical Templates: • Sample Size – Discrete and Continuous • 1 Sample t Confidence Interval for Mean • 2 Sample t-Test (Assume Equal and Unequal Variances) • 1 Sample Confidence Interval for Standard Deviation • 2 Sample F-Test (Compare 2 StDevs) • 1 Proportion Confidence Interval (Normal and Exact) • 2 Proportions Test & Fisher’s Exact • Probability Distribution Calculators: • Normal, Lognormal, Exponential, Weibull • Binomial, Poisson, Hypergeometric
Templates & Calculators • Basic MSA Templates: • Gage R&R Study – with Multi-Vari Analysis • Attribute Gage R&R (Attribute Agreement Analysis) • Basic Process Capability Templates: • Process Sigma Level – Discrete and Continuous • Process Capability & Confidence Intervals • Basic DOE Templates: • 2 to 5 Factors • 2-Level Full and Fractional-Factorial designs • Main Effects & Interaction Plots • Basic Control Chart Templates: • Individuals • C-Chart
Templates & Calculators: Value Analysis/Process Load Balance Chart
Templates & Calculators: Failure Mode & Effects Analysis (FMEA)
Templates & Calculators: Two-Proportions Test & Fisher’s Exact
Templates & Calculators: Normal Distribution Probability Calculator
Graphical Tools • Basic and Advanced (Multiple) Pareto Charts • EZ-Pivot/Pivot Charts • Run Charts (with Nonparametric Runs Test allowing you to test for Clustering, Mixtures, Lack of Randomness, Trends and Oscillation.) • Basic Histogram • Multiple Histograms and Descriptive Statistics (includes Confidence Interval for Mean and StDev., as well as Anderson-Darling Normality Test) • Multiple Histograms and Process Capability (Pp, Ppk, Cpm, ppm, %)
Graphical Tools • Multiple Boxplots and Dotplots • Multiple Normal Probability Plots (with 95% confidence intervals to ease interpretation of normality/non-normality) • Multi-Vari Charts • Scatter Plots (with linear regression and optional 95% confidence intervals and prediction intervals) • Scatter Plot Matrix
Graphical Tools: EZ-Pivot/Pivot Charts – The power of Excel’s Pivot Table and Charts are now easy to use!
Graphical Tools:Multiple Histograms & Descriptive Statistics
Graphical Tools:Multiple Scatterplots with Linear Regression Linear Regression with 95% Confidence Interval and Prediction Interval
Statistical Tools • P-values turn red when results are significant (p-value < alpha) • Descriptive Statistics including Anderson-Darling Normality test, Skewness and Kurtosis with p-values • 1 Sample t-test and confidence intervals • Paired t-test, 2 Sample t-test • 2 Sample Comparison Tests • Normality, Mean, Variance, Median • Yellow Highlight to aid Interpretation
Statistical Tools • One-Way ANOVA and Means Matrix • Two-Way ANOVA • Balanced and Unbalanced • Equal Variance Tests: • Bartlett • Levene • Welch’s ANOVA • Correlation Matrix • Pearson’s Correlation Coefficient • Spearman’s Rank
Statistical Tools • Multiple Linear Regression • Binary and Ordinal Logistic Regression • Chi-Square Test (Stacked Column data and Two-Way Table data) • Nonparametric Tests • Power and Sample Size Calculators • Power and Sample Size Charts
Statistical Tools: Two-Sample Comparison Tests P-values turn red when results are significant! Rules based yellow highlight to aid interpretation!
Statistical Tools: Multiple Linear Regression • Accepts continuous and/or categorical (discrete) predictors. • Categorical Predictors are coded with a 0,1 scheme making the interpretation easier than the -1,0,1 scheme used by competitive products. • Interactive Predicted Response Calculator with 95% Confidence Interval and 95% Prediction Interval.
Statistical Tools: Multiple Linear Regression • Residual plots: histogram, normal probability plot, residuals vs. time, residuals vs. predicted and residuals vs. X factors • Residual types include Regular, Standardized, Studentized • Cook's Distance (Influence), Leverage and DFITS • Highlight of significant outliers in residuals • Durbin-Watson Test for Autocorrelation in Residuals with p-value • Pure Error and Lack-of-fit report • Collinearity Variance Inflation Factor (VIF) and Tolerance report • Fit Intercept is optional
Statistical Tools: Multiple Regression Multiple Regression accepts Continuous and/or Categorical Predictors!
Statistical Tools: Multiple Regression Durbin-Watson Test with p-values for positive and negative autocorrelation!