Download
1 / 32
320 likes | 332 Views
Explore the evolution of digitally enabled genomic medicine and personalized healthcare through wireless monitoring, sensor data integration, and AI-driven analytics. Discover how tracking individual metabolic and physical variables in real-time enables preventive and personalized medicine, revolutionizing health management.

E N D
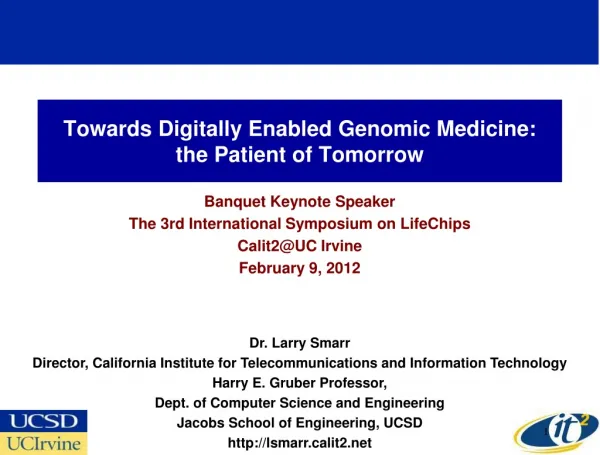
From Digitally Enabled Genomic Medicineto Personalized Healthcare Invited Colloquium Philips Eindhoven Eindhoven, Netherlands December 8, 2011 Dr. Larry Smarr Director, California Institute for Telecommunications and Information Technology Harry E. Gruber Professor, Dept. of Computer Science and Engineering Jacobs School of Engineering, UCSD http://lsmarr.calit2.net
Calit2 Has Been Had a Vision of “the Digital Transformation of Health” for a Decade • Next Step—Putting You On-Line! • Wireless Internet Transmission • Key Metabolic and Physical Variables • Model -- Dozens of Processors and 60 Sensors / Actuators Inside of our Cars • Post-Genomic Individualized Medicine • Combine • Genetic Code • Body Data Flow • Use Powerful AI Data Mining Techniques www.bodymedia.com The Content of This Slide from 2001 Larry Smarr Calit2 Talk on Digitally Enabled Genomic Medicine
San Diego Has Become the National Center for Wireless Health
Over the Next Decade an Explosion of Health Sensing:Center for Wireless &Population Health Systems Sensors embedded in the environment Geocoded data on safety, location of recreation, food, hazards, etc Sensor data + Clinical & Personal Health Record Data + Ecological data on determinants of health + Analysis & comparison of parameters in near-real time (normative and ipsative) + Sufficient population-level data to comprehend trends, model them and predict health outcomes + Feedback in near real-time via SMS, audio, haptic or other cues for behavior or change in Rx device Psychological & Social sensors Mood, Social network (peers/family) Attention, voice analysis Biological sensors BP, Resp, HR, Blood (e.g. glucose, electrolytes, pharmacological, hormone), Transdermal, Implants Diet & Physical Activity sensors Physical activity (PAEE, type), sedentary Posture/orientation, diet intake (photo/bar code) Wearable Environmental sensors Air quality (particulate, ozone, etc) Temperature, GPS, Sound, Video, Other devices & embedded sensors = True Preventive Medicine!
Wireless Monitoring HelpsDrive Exercise Goals www.bodymedia.com Elliptical Up and Down House Steps Gardening 25 Week Average: 2473 Calories Burned/Day 1:19 hr Physical Activity/Day (>3 METs) 6887 Steps/Day (~3.4 Miles) Measure Quantity and Quality of Sleep 25 Week Ave: 6:51 hrs with 81% Efficiency
Quantifying My Sleep Pattern Using Zeo -Surprisingly About Half My Sleep is REM! REM is Normally 20% of Sleep Mine is Between 45-65% of Sleep An Infant Typically Has 50% REM
Physical Activity Location Measurement System (PALMS) • Integrated Suite of Sensors & Software Enabling Continuous Capture & Analysis of Temporal / Spatial Data • Characteristics of Physical Activity & Other Data Important to Exposure Biology Research • PALMS Supports Gathering Data from Multiple Participants Within Studies & Aggregating / Comparing Data Between & Among Multiple Researchers Across Studies Funded through the NIH Gene, Environment and Health Initiative Exposure Biology Program NIH/NCI Grant 1 U01 CA130771
PALMS was Recently Featured in Nature on Measuring the Exposome Feb 16, 2011
CitiSense –New NSF Grant for Fine-Grained Environmental Sensing Using Cell Phones Seacoast Sci. 4oz 30 compounds CitiSense Intel MSP contribute sense retrieve W EPA L C/A S discover “display” distribute F CitiSense Team PI: Bill Griswold Ingolf Krueger Tajana Simunic Rosing Sanjoy Dasgupta Hovav Shacham Kevin Patrick
Lifechips--Merging Two Major Industries: Microelectronic Chips & Life Sciences LifeChips: the merging of two major industries, the microelectronic chip industry with the life science industry 65 UCI Faculty LifeChips medical devices
I am the Future Digital Health Consumer: Measuring the State of Your Body and “Tuning” It I Arrived in La Jolla in 2000 After 20 Years in the Midwest and Decided to Move Against the Obesity Trend 2010 1999 2000 Age 61 Age 51 Now the Top Listed ArticleBy Google for “Larry Smarr” www.xconomy.com/san-diego/2010/05/12/how-internet-pioneer-larry-smarr-lost-20-pounds-by-becoming-a-quantified-self/
Goal: Lose Weight by Changing What &How Much I Eat,While Increasing Aerobic Exercise Exercise is Elliptical and Walking Gradually Moving to Zone Diet and Regular Exercise 182±4 lbs. Blood Pressure 134/73 Pulse 55 Resting Pulse Lowered to 45
Goal: Quantify Your Food Intake So You Can “Tune” Your Glucose/Insulin System and Lower Inflammation Computed Average Over 12 Days When at Home for Maximum Accuracy Measure All Food and Drink Components, Then Use USDA Lookup to Compute Each Item Still Need to Lower Sugar & Increase Protein and Decrease Fat by 15% • Quality of Food • All Organic and Mostly Locally Grown • Carbs are Low Glycemic Index • No Added Sugar or Refined Flour – Mostly Fruits and Vegetables • Proteins are Lean • Meat is Grass Fed – No Corn or Antibiotics • Fish is Wild, Often Locally Caught • Fats are Omega-3 Rich • Supplemented by 7g Daily Pharmaceutically Purified Fish Oil Pills
Where I Believe We are Headed: Predictive, Personalized, Preventive, & Participatory Medicine I am Leroy Hood’s Lab Rat! Quantify ~2500 Blood Proteins, 50 Each from 50 Organs or Cell Types from a Single Drop of Blood To Create a Time Series www.newsweek.com/2009/06/26/a-doctor-s-vision-of-the-future-of-medicine.html
Goal: Change Your Cholesterol Levelsto Lower LDL, Raise HDL, While Lowering Total Total -40% LDL -45% HDL +33% Began Statin Raising “Good” HDL Seems Most Difficult
Goal: Lower Triglycerides and Cholesterol Ratios to Reduce Future Risk of Diabetes and Heart Disease “The Ratio of Triglycerides to HDL Cholesterol (TG/HDL-C) is the Single Most Powerful Lipid Predictor of Extensive Coronary Disease.” [Clinics 2008; v.64: 427-432] • TG • High Risk 200-500 • Best <150 • My TG ~35 • TG/HDL • Ratio>4 Are Pre-Diabetic or Have Type 2 Diabetes • Average American Has a Ratio of ~3.3 • My Ratio 0.5
Goal: Lower Ratio of Arachidonic Acid to EPA to Reduce Pro-Inflammatory Potential of Your Cells “Silent Inflammation” Chronically Ill American I take 6 Fish Oil Pills Per Day Average “Healthy” American Ideal Range My Range Range Source: Barry Sears My Tests by www.yourfuturehealth.com
Blood Tests I Do Quarterly to AnnuallyIn Addition to Lipids & Omegas • Electrolytes • Sodium, Potassium, Calcium, Magnesium, Phosphorus, Boron, Chlorine, CO2 • Micronutrients • Arsenic, Chromium, Cobalt, Copper, Iron, Manganese, Molybdenum, Selenium, Zinc • Blood Sugar Cycle • Glucose, Insulin, A1C Hemoglobin • Cardio Risk • Complex Reactive Protein • Homocysteine • Kidneys • Bun, Creatinine, Uric Acid • Protein • Total Protein, Albumin, Globulin • Liver • GGTP, SGOT, SGPT, LDH, Total Direct Bilirubin, Alkaline Phosphatase • Thyroid • T3 Uptake, T4, Free Thyroxine Index, FT4, 2nd Gen TSH • Blood Cells • Complete Blood Cell Count • Red Blood Cell Subtypes • White Blood Cell Subtypes • Cancer Screen • CEA, Total PSA, % Free PSA • CA-19-9 • Vitamins & Antioxidant Screen • Vit D, E; Selenium, ALA, coQ10, Glutathione, Total Antioxidant Fn.
But, In Spite of My High Levels of Omega-3s, Blood Measurements Show Chronic Inflammation 15x Normal hsCRP from Blood Tests Symptom: Acute Diverticulitis “Come Back When You Have a Symptom” Inflammation 5x Normal Antibiotics hsCRP Good Range
Carotid Artery Ultrasound Reveals Plaque Thickness Significantly Increasing In Just Two Years Oct 31 2008 October 14, 2010 Left 0.75 to 0.84 mm 12% Thicker Plaque Right 0.59 to 0.73mm 24% Thicker Plaque
Measuring Stool and Blood Markers Revealed Episodic Inflammation Peaks of CRP and Lactoferrin Stool Tests by yourfuturehealth.com “Significant Inflammation of Sigmoid Colon” Colonoscopy May 2006 Peaks 25-30x Normal Colonoscopy December 2010 “Mild Inflammation of Colonic Muscosa” hsCRP Good Range Lactoferrin Good Range
High Level Crohn’s Flares Are Quite Sudden:Will be Missed Without Frequent Measurements Colonoscopy May 2011 Colonoscopy December 2010 Colonoscopy May 2006 Biopsies and Lactoferrin Values Confirm CD
I Wondered if Crohn’s is an Autoimmune Disease, Did I Have a Personal Genomic Polymorphism? From www.23andme.com Polymorphism in Interleukin-23 Receptor Gene— 80% Higher Risk of Pro-inflammatoryImmune Response ATG16L1 IRGM NOD2 SNPs Associated with CD 2009
Antibiotics Are Highly Disruptive of Colon Microbiome--Takes 3-4 Years to Recover These Tests Culture Bacteria All 3+ or 4+ Three Weeks Before Taking Antibiotics “Good” Microbes Next Step Get DNA Microbe Metagenomics, Parasite, Yeast Test Three Years After 10 Days of Antibiotics Levaquin & Metronidaloze “Bad” Microbes
The Human Microbiome is the Next Large NIH Drive to Understand Human Health and Disease • “A majority of the bacterial sequences corresponded to uncultivated species and novel microorganisms.” • “We discovered significant inter-subject variability.” • “Characterization of this immensely diverse ecosystem is the first step in elucidating its role in health and disease.” 395 Phylotypes “Diversity of the Human Intestinal Microbial Flora” Paul B. Eckburg, et al Science (10 June 2005)
Crohn’s Disease Patients Have Number of Gut Microbe Species in Firmicutes Phyla Reduced by Over 2/3! Healthy Gut Microbes IBD Gut Microbes While Bacteroidetes Species Count is the Same Manichanh, et al, Gut 2006;55:205–211
My Warning Signs From Cultured Microbesof IBD • Clostridia Species Dropping to Low Values • Clostridia are the bacteria are primarily responsible for butyrate production, the main energy source for colonic epithelial wall • Clostridia provide proinflammatory cytokines inhibition in the colonic muscosa • My Butyrate Values Are Very Low • “Loss of butyrate producers observed here could upset the dialogue between host epithelial cells and resident microorganisms, hence contributing to the development of CD associated ulcerations.” • Manichanh, et al, Gut 2006;55:205–211
Microbial MetagenomicsCan Diagnose Disease States From www.23andme.com Mutation in Interleukin-23 Receptor Gene—80% Higher Risk of Pro-inflammatoryImmune Response IBD Patients Harbored, on Average, 25% Fewer Microbial Genes than the Individuals Not Suffering from IBD. SNPs Associated with CD 2009
To Understand Causes of IBD, One Needs to Look at Interplay of Genes and Colonic Microbes Associations between IBD and genes that regulate microbial recognition and innate immune pathwaysindicate the important roles of host-microbe interactions in regulating intestinal immune homeostasis. There is increasing evidence that intestinal microbes influence host immune development, immune responses, and susceptibility to human diseases such as IBD, diabetes mellitus, and obesity. GASTROENTEROLOGY 2011;140:1729–1737
Understanding Autoimmune Diseases Will Require Complete Genomes, Microbial Metagenomics Over Populations Follow Molecular Interactions with Proteomics, Metabolomics, &Transcriptomics of Joint Genomic Production of Human DNA and Microbiome DNA ~80% of Our Immune System is Based in our Gut