Download

1 / 29
290 likes | 552 Views
General Regression Neural Network Model for Growth of Salmonella Serotypes on Chicken Skin for Use in Risk Assessment. Thomas P. Oscar, Ph.D. USDA, ARS Princess Anne, MD. Risk Assessment Data Gaps. Strain variation. Microbial competition. Initial dose. Food matrix.

E N D
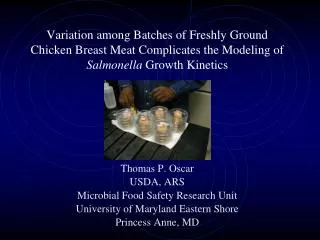
General Regression Neural Network Model for Growth of Salmonella Serotypes on Chicken Skin for Use in Risk Assessment Thomas P. Oscar, Ph.D. USDA, ARS Princess Anne, MD
Risk AssessmentData Gaps • Strain variation • Microbial competition • Initial dose • Food matrix
Must have been that chicken! Strain Variation • Salmonella enterica serotypes (> 2,300) • Top three in chickens are: Enteritidis Typhimurium Kentucky
Strain Variation Autoclaved chicken meat at 25C J. Food Safety (2000) 20:225-236.
Microbial Competition J. Food Prot. (2003) 66(2):200-207; (2006) 69(2):276-281.
Microbial Competition • Natural Antibiotic Resistance • Bad for public health • Good for predictive microbiology Salmonella Typhimurium DT104 J. Food Prot. (2008) 71(6):1135-1144. J. Food Prot. (2006) 69(9):2048-2057. J. Food Prot. (2009) 72(2):304-314.
Initial Dose Food Microbiol. (2007) 24:640-651.
Regression Modeling Tertiary Model Secondary Models Predicted W W Model Observed W Observed N(t) Observed PI Predicted PI PI Model Primary Model Primary Model m Model Observed m Predicted m Predicted N(t) Predicted N(t) Nmax Model Observed Nmax Predicted Nmax J. Food Prot. (2005) 68(12):2606-2613.
Neural Network Modeling • General Regression Neural Network (GRNN) • Better performance than regression models • User-friendly commercial software • Compatible with Monte Carlo simulation software Jeyamkondan et. al., 2001
Objective • To develop a GRNN and simulation model for growth of Salmonella on chicken skin as a function of serotype for use in risk assessment. • Short-term temperature abuse (0 to 8 h)
5 l 7 cfu Materials and Methods • Experimental Design (3 x 10 x 5 x 2 x 2) • Serotypes (Typhimurium, Kentucky, Hadar) • 30C in BHIB for 23 h at 150 opm } prehistory • Temperature (5, 10, 15, 20, 25, 30, 35, 40, 45, 50C) • Time (0, 2, 4, 6, 8 h) • Trial (1, 2) • Sample (a, b)
Materials and Methods CFU MPN
Materials and Methods Poultry isolates • Plating Media • XLH-CATS for Typhimurium • XLH-NATS for Kentucky • XLH-TUGS for Hadar Ingredients XL = xylose lysine H = HEPES C = chloramphenicol A = ampicillin T = tetracycline S = streptomycin N = novobiocin U = sulfisoxazole G = gentamicin MPN drop plate
General Regression Neural Network ŷ Output Summation Layer N(x) D(x) Predicted Value -0.01 … … 7.37 Pattern Layer Distance Function S T t Input Layer Serotype Temp. time Specht, 1991
Step 1 Enter data
Step 2 Define the data set
Step 3 Set the training parameters
Step 4 Train the GRNN
Step 5 Review results
92% Acceptable J. Food Prot. (2006) 69(9):2048-2057.
89% Acceptable J. Food Prot. (2006) 69(9):2048-2057.
Step 6 Predict
Step 7 Integrate with risk assessment
-1 Correlation 0 Correlation
Easy to develop Low cost Flexible predictions Superior performance Conclusion #1 Neural network modeling outperforms regression modeling in predictive microbiology applications
Conclusion #2 • Cocktail of Typhimurium_Kentucky_Hadar • Overly ‘fail-safe’ predictions for Kentucky.
Conclusion #3 GRNN model was successfully validated for risk assessment model? Data Gaps Strain variation Microbial competition Initial dose Food matrix
I hope it was Kentucky! Acknowledgements • Thank you for your attention! • Thanks to Jaci Ludwig of ARS and Celia Whyte and Olabimpe Olojo of UMES for their outstanding technical assistance on this project.