Download
1 / 30
300 likes | 387 Views
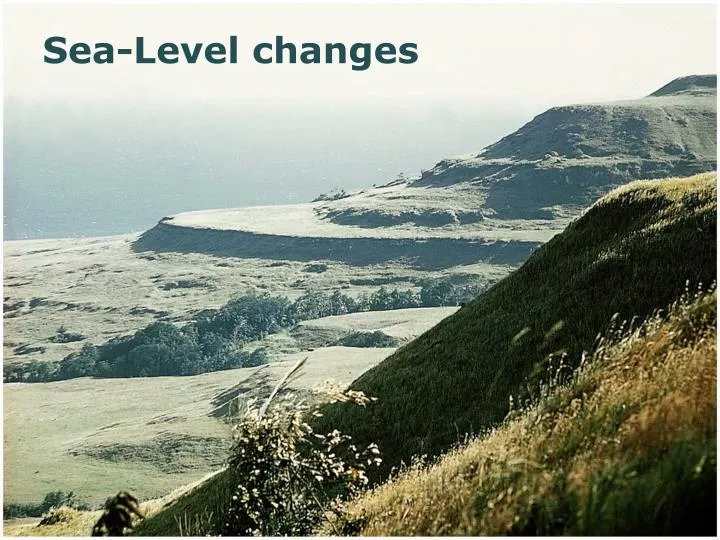
Sea-Level changes. Learning Objectives. The shape of the planet: difference between Geoid and Ellipsoid The concept of M ean S ea L evel Article: http://www.esri.com/news/arcuser/0703/geoid1of3.html Processes that control the M ean S ea L evel and its changes

E N D
Learning Objectives • The shape of the planet: difference between Geoid and Ellipsoid • The concept of Mean Sea Level • Article: http://www.esri.com/news/arcuser/0703/geoid1of3.html • Processes that control the Mean Sea Level and its changes • Sea level changes over millions of year • Sea level changes over the recent geologic past
What does it mean to be at an altitude of 4000 m? It means that I am 4000 m above the Mean Sea Level (MSL)
Model of the shape of the Earth geoid: The equipotential surface of the Earth's gravity field which best fits, in a least squares sense, global mean sea level (MSL) http://www.ngs.noaa.gov/GEOID/geoid_def.html
by definition: • Mean Sea Level = 0 m = equilibrium level • Changes in volume of water • Changes in shape and volume of ocean basins • Changes are measured as relative changes to a reference datum • This reference datum can be a fixed one (e.g. distance from the center of the earth) or local (coastline).
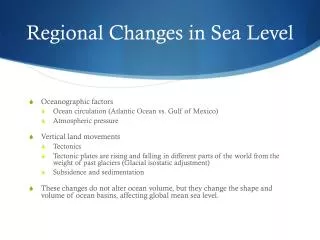
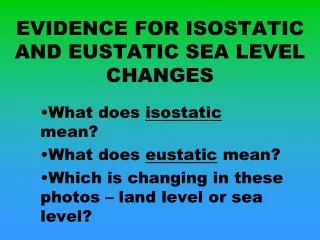
A change in volume of seawater in one ocean will affect the level in all others. Any such world-wide change in sea-level is called EUSTATIC SEA-LEVEL change A change in local sea level measured with respect to a land reference point is referred to as a RELATIVE SEA-LEVEL change
Other effects of plate tectonics e.g. Upper Cretaceous (90 Ma) MSL > 300 m
Summary of spatial-temporal scale of processes contributing to Mean Sea Level (D) Plate Tectonics 100 m (C) Melting of ICE Load from ice sheets deforms crust • Thickness and area of • continental crust • Thermal state (age) of crust • sediment loading MSL (meters) 10 m (A) Exchange of water with continents (Groundwater, Lakes, etc.) (B) Temperature expansion 1 m NOTE: A,B,C change in volume of water D change in shape of container 1 cm 1000 100 Ka 10 Ma 100 Ma 1 day 100 TIME (years)
Other processes complicating the study of mean sea level (ice or sediment loads) The concept of Post Glacial Rebound (PGR) !!!
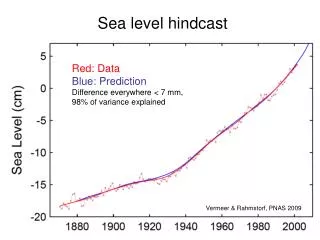
Last Glacial Maximum: 20 thousand years ago Laurentide Ice Sheet, 3-4km thick All this ice caused a EUSTATIC sea level drop of 125m How do we know this?
Aerial view of glaciated Bylot Island, Canada U-shaped valley Glacial Striations Glacial Flow
Date coral samples from various paleo-sea levels. Barbados is the “dipstick” for eustatic sea level reconstruction Now what?
Corals for paleo-sea level reconstruction From corals we know that LGM sea level was -125m
The subsidence of the Northern Sea (associated with relaxation from glacial loading) Rate of change in Sea Level mm/year Scandinavia Northern Sea Great Britain
Geological proxy for sea level change: 18O/16O in foraminifera Oxygen has two stable isotopes: 16O (99.8%) and 18O (0.2%) Rainfall and Ice are very depleted in 18O (lots more 16O) So when you build ice sheets, ocean loses 16O, becomes 18O-rich Forams record ocean 18O/16O ratio in shells 21,000 ybp
Take-home points: • eustatic vs. local sea level • lots of new, young, hot crust means higher sea level; • tectonic changes on 10-100Ma timescales Wilson cycle • glacial cycles have several impacts on sea level: • 1) ice sheets remove water lower sea level • 2) glacial loading/unloading reshapes crust under • and surrounding ice sheets • - changes occur on 10-100ky timescales • tools for studying sea level change through geologic time: • 1) radiocarbon-date marine shells & corals found at • known elevation (above MSL) and depth (below MSL) • 2) deep-sea sediment 18O record