Download
1 / 30
300 likes | 405 Views
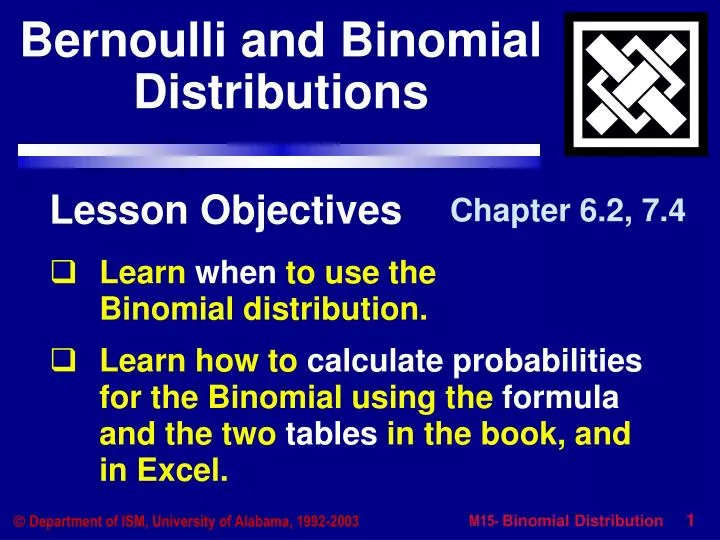
Bernoulli and Binomial Distributions. Lesson Objectives. Chapter 6.2, 7.4. Learn when to use the Binomial distribution. Learn how to calculate probabilities for the Binomial using the formula and the two tables in the book, and in Excel. Does a person have ESP? . Experiment:.

E N D
Bernoulli and Binomial Distributions Lesson Objectives Chapter 6.2, 7.4 • Learn when to use the Binomial distribution. • Learn how to calculate probabilitiesfor the Binomial using the formulaand the two tables in the book, andin Excel.
Does a person have ESP? Experiment: • Two people in different rooms. • “A” is shown one of the five cards, selected randomly. “A” transmits his thoughts. • “B” selects the card she thinks is beingsent to her, and records it. • If the two cards match, a success occurs. P(X = 1) = ___ = p P(X = 0) = ___ = 1- p X = 1 success = 0 failure Bernoulli (p = ____ ) X ~
Bernoulli Distribution A discrete data distribution used to describe a population of binary variable values. Binary one of only two outcomescan occur, coded as “0” or “1”
k 0 1 P(X=k) Bernoulli distribution, “one” trial. 1 pp Bernoulli has one parameter:p = the probability of success. Bernoulli (p) X ~ m = The mean of of the Bernoulli is s = The standard deviation is
k 0 1 P(X=k) 1 pp s = p(1 - p) Bernoulli distribution, “one” trial. How are the “mean” and “standard deviation” determined? Use the same equations as the previous section. m = p 0•(1-p) + 1•p = a little algebra . . . s2 = (0 - p)2 • (1 - p) + (1 - p)2 • p = p2 • (1 - p) + (1 - p)2 • p = p(1 - p) • [ p + (1 - p) ] = p(1 - p) Once we know these results, we don’t need to derive it again.
Sex (male or female) Major (business or not business) Defective? (defective or non-defective) Response to a T-F question (true or false) Where student lives (on-campus or off-campus) Credit application result (accept or deny) Own home? (own or rent) Course result (Pass or Fail) Examples of Bernoulli Variables
Bar Chart of Population for ESP 1.0 1–p p 0 X 0 1
Binomial Distribution A discrete data distribution used to model a population of counts for “n” independent repetitions of a Bernoulli experiment. • Conditions: • a fixed number of trials, “n”. • all n trials must be independent of each other. • the same probability of success on each trial. • X = count of the number of successes.
Binomial distribution, “n trials” k 0 1 2 3 n P(X = k) to be determined Binomial has two parameters:n = the fixed number of trials, p = the probability of success for each trial. X ~ Bino( n, p) m = The mean of of the Binomial is s = The standard deviation is
Formula gives P(X = k), the probability for exactly one value. Tables Table A.1 gives P(X = k),the probability for exactly one value. or Table A.2 gives P(X < k),the cumulative probability forX = 0 through X = k. Computing Binomial probabilities For selected values of n and p. • Excel (BINOMDIST function),gives either individual or cumulative.
A count of the number of females in a sampleof 80 fans at a Rolling Stones concert. A count of the number of defectives in sampleof 50 tires coming off a production line. A count of the number of the number of corrects answers on 10 true-false questionsfor which everybody guessed. A count of the number of credit applications that are denied from a sample of 200. Examples of Binomial Variables
Are these situation Binomial? • A count of the number of fans at a Stones concert needed until we find 50 females. • A count of the number of defectives tires coming off a production line in one year. • Count of people choosing Dr Pepper over Pepsi in a blind taste-test with 20 people. • A count of the number of playing cards that are diamonds in a sample of 13 cards. • A count of the number of credit applications that are accepted from a sample of 200.
If the population of X-values has a binomial data distribution, then the proportion of the population having the value k is given by: n k ( ) pk (1 – p)n–k P(X = k ) = for k = 0, 1, 2, ..., n This is also the probability that a single value of X will be exactly equal to x.
Little “k” is a “specific value”of Big X. Big “X” is the “random variable.” Example:P( X = k)P( Count = 4) n k ( ) pk (1 – p)n–k P(X = k ) =
n k () pk (1 – p)n–k P(X = k ) = ( ) n k = n! = 0! =
These are the possible values of X;each value has its own probability. ( ) n x px (1 – p)n–x P(X = x ) = x = 0, 1, 2, ..., n
Does a person have ESP? Experiment: Repeat the experiment 5 times. X = a count of the number of successes.X ~ Bino(n=5, p =.20) Find the probability of exactlyone success. 1 4 5 1 .20 .80 P(X=1) = P(X=3) = = 5 • .20 • .4096 = .4096
0 5 1 4 2 3 5 0 5 1 5 2 + + = .20 .80 .20 .80 .20 .80 P(X < 2) = ESP Experiment Bino(n=5, p =.20) Find the probability of two or fewer successes. P(X = 0) + P(X = 1) + P(X = 2) = 1• 1•.32768 + 5•.20•.4096 + 10•.04•.5120 = .32768 + .4096 + .2048 = .94208
Table A.2 gives P( X < k ) p 0.2 p 0.2 n = 5 n = 5 k: k: .3277 .4096 .2048 .0512 .0064 .0003 0 1 2 3 4 5 0 1 2 3 4 5 P( X < 2 ) = ESP Experiment Bino(n=5, p =.20) Cumulative Individual Table A.1 gives P( X = k ) .3277 .7373 .9421 .9933 .9997 1.0000 P( X = 2 ) = .2048 .9421
TableA.2 gives P( X£ k ) Bino(n=8, p =.20) For the multiple choice test with 8 questions, 5 choices for each, find the probability of getting two or fewer correct. 0.2 k .1678 .5033 .7969 .9437 .9896 .9988 .9999 1.000- 1.0000 0 1 2 3 4 5 6 7 8 About 80% of the classshould have two orfewer correct; about 20% should havethree or more correct.
0.2 k .1678 .5033 .7969 .9437 .9896 .9988 .9999 1.000- 1.0000 0 1 2 3 4 5 6 7 8 TableA.2 gives P( X£ k ) Bino(n=8, p =.20) For the multiple choice test, find the probability of more the one but no more than three correct. Same question as . . . “two or more but less than four;”or “exactly two or three.”
0.2 k .1678 .5033 .7969 .9437 .9896 .9988 .9999 1.000- 1.0000 0 1 2 3 4 5 6 7 8 TableA.2 gives P( X£ k ) Bino(n=8, p =.20) For the multiple choice test find the probability of three or more. k P( X3) = 1.000 – P(X£2) = 1.000 – .7969 = .2031 Same question as . . . “more than two”
0.2 k .1678 .5033 .7969 .9437 .9896 .9988 .9999 1.000- 1.0000 0 1 2 3 4 5 6 7 8 TableA.2 gives P( X£ k ) Bino(n=8, p =.20) P( 3 or morecorrect) = P(more than 3 correct) = Watch the wording!
0.2 k .1678 .5033 .7969 .9437 .9896 .9988 .9999 1.000- 1.0000 0 1 2 3 4 5 6 7 8 TableA.2 gives P( X£ c ) Bino(n=8, p =.20) Find the probability ofat least one correct.
Does a person have ESP? Experiment: Repeat the experiment 20 times. X = a count of the number of successes.X ~ Bino(n=20, p =.20) The probability of observing a result this extreme is 0.0026. Beth and Mike matched 10 times? Is this unusual? This is a rare event! The evidence indicatesthat they do better thanguessing. P(X10) = = =
Does a person have ESP? X = a count of the number of successes.X ~ Bino(n=20, p =.20) Expected valuem = _______ Standard deviations =
Free throws • Are shots independent? • Evidence says yes. • Suppose probability of Mo making one free throw is .70. • Mo will shoot 9 shots.
So, let Y = count of misses. Y~ B ( ) Let X = count of shots made, X ~ B ( ) n = 9, p = .70 Find probability he misses fewer than three. n = 9, p = _____
Count p Y 0 1 2 3 4 5 6 7 8 9 MissesX 9 8 7 6 5 4 3 2 1 0 Hits ? .70 P( Y£ 2 ) P( Y < 3 ) = = 1 - P( X£ 6 ) P( X > 6 ) = = = Lookup in Tables.
Moral: Pay attention to what you are counting!