Download
1 / 37
370 likes | 515 Views
THE FIVIMS GLOBAL GIS DATABASE (FGGD). FAO component of the Poverty and Food Insecurity Mapping Project Lead FAO Unit: SDRN. Other main partners: IIASA, CIESIN. Project Funding: Government of Norway and FIVIMS. COMPONENT 2: Global Analyses and Databases (Task Manager: FAO/SDRN).

E N D
THE FIVIMS GLOBAL GIS DATABASE (FGGD) FAO component of the Poverty and Food Insecurity Mapping ProjectLead FAO Unit: SDRN Other main partners: IIASA, CIESIN Project Funding: Government of Norwayand FIVIMS
COMPONENT 2: Global Analyses and Databases (Task Manager: FAO/SDRN) • COMPONENT 1: Country Case Studies (Task Managers: 7 CGIAR Centers: CIAT, CIMMYT, IFPRI, IITA,ILRI, IRRI, IWMI) • COMPONENT 3: Outreach and Dissemination of the Results (Task Manager: UNEP-GRID-Arendal) www.povetymap.net The Poverty and Food Insecurity Mapping Project has three components implemented by 9 partners:
The seven country case studies done by the seven CGIAR Centers: • CIAT: Ecuador • CIMMYT: Mexico • IFPRI: Malawi • IITA: Nigeria • ILRI: Kenya • IRRI: Bangladesh • IWMI: Sri Lanka
The main objective of the FAO component: DEVELOPMENT OF THE FIVIMS GLOBAL GIS DATABASE (FGGD) The FGGD is a GIS database and modeling framework for better understanding of the global poverty and food insecurity issues in SPATIAL and ENVIRONMENTAL contexts related to agricultural productivity and accessibility.
The main expected use of the FGGD: to be used as the main Global GIS database needed for implementation of the plans of actions of the three summits. MILLENIUM WORLD FOOD SUMMIT +5 JOHANNESBURG SUMMIT SUMMIT
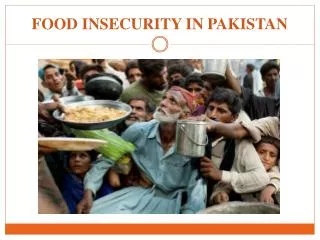
IT IS ESTIMATED THAT THERE ARE OVER 800 MILLION UNDERNOURISHED AND APPROXIMATELY 2 BILLION POOR PEOPLE THESE FIGURES ARE BASED ON NATIONAL STATISTICS BUT, IN ORDER TO UNDERSTAND THE DRIVERS OF HUNGER AND POVERTY WE ALSO NEED TO KNOW WHERE THEY LIVE
IN PARTICULAR, ...WE NEED TO KNOW WHERE THEY ARE IN RELATION TO: • Agroecological zones • Marginal and productive lands • Major crops and livestock production systems • Market access • Livelihood systems
Poverty mapping: Two approaches • Bottom-up approach: Using socio-economic data aggregated by administrative boundaries such as survey/census data • Top-down approach: Using satellite imagery, existing global environmental maps and GIS models.
LEVEL 4: Maps for analysis of vulnerability: Accessibility Pixel Ag. Economic Value Actual crop zones for 28 crops Livestock production Rural Population density Population Density in 2015; Subnational Nutrition Profiles, GRID resolution: 5 arc-minutes The hierarchy of the maps in FGGD Vector data scale: 1: 5 million LEVEL 3:Maps Based on Models: Potential crop zones for 28 major crops Agro-ecological Zones, Length of Growing Period Pixel shares of 4 land-use classes: Croplands, Pasture, Forest and Other Lands Environmental Constraints, Multiple cropping zones LEVEL 2: Primary data layers: Soil and terrain properties, Farming system zones, Precipitation, Temperature, Protected Areas, Irrigated Areas, LEVEL 1: Base Maps: Coastlines, DEM, National and Subnational Boundaries,
GIS technology constraints: Low accuracy at low resolution BARBADOS Pixelizationat 30x30 arc-seconds Comparison of the two pixel sizes Pixelization at 5x5 arc-minutes
GIS technology constraints: maps from different sources may not match FAO/UNESCO Soil map of the World UN standard coastlines/country boundaries Landscan population density map
POTENTIAL SUITABILITY INDEX MAPS COMPLETED FOR 28 CROPS WHICH ACCOUNT FOR ABOUT 70% OF GLOBAL CROP PRODUCTION
FUTURE WORK: What can we learn by analysing accessibility maps at global scale? • e.g. in India, there are approximately 147 million people (15%) living more than 5 km away from roads.
FUTURE WORK: What can we learn by analysing environmental maps at global scale? • e.g. one preliminary figure: about 620 million people live in agro-ecological zones, where moisture and temperature allow crop growth for less than 120 days. • incomes of these people have to come mainly from sources other than rain-fed cropping (e.g. irrigated cropping, livestock, etc.) • …and we would like to know what will the number of these people also in 2015.
Future work: DRAFT
Future work (cont’d): • Do an intervention analysis in vulnerable areas, e.g. comparing various irrigation projects for the percent arid lands and the number of people to be affected • Do a meta analysis of the seven country case studies completed by the CG Centers and 15-20 country level poverty maps done by the WB • Explore how top-down and bottom-up approaches could be combined to complement each other
Important questions to be answered to assist Science Council’s priority setting role are the following: • Are most of the poor in a country/region rural or urban? • Are most of the rural poor in Favorable Rural Areas (FRA) or in Marginal Rural Areas (MRA)? • What are the commodities and farming systems for FRAs in a country? What are the poor’s farming systems in these FRA? • What are the commodities and farming systems for MRAs in a country? What are the poor’s farming systems in these MRA?
Thank you. ergin.ataman@fao.org www.povertymap.net www.fao.org
2 billion people living in extreme poverty ( less than PPP$1/day) at the time of the WFSfyl (2002)