Download

1 / 30
300 likes | 423 Views
What’s im PORT ant in 2013? The Commercial R.E. Crystal Ball indicates…. ACREcon 2013 “Traction in the New Age of Commercial R.E. Birmingham, AL February 1, 2013. K.C. Conway, MAI, CRE Exec. Managing Dir. R.E. Analytics Colliers International KC.Conway@Colliers.com.

E N D
What’s imPORTant in 2013? The Commercial R.E. Crystal Ball indicates… ACREcon 2013 “Traction in the New Age of Commercial R.E. Birmingham, AL February 1, 2013 K.C. Conway, MAI, CRE Exec. Managing Dir. R.E. Analytics Colliers International KC.Conway@Colliers.com
Federal Reserve Bank of Atlanta A Bank Supervisor’s View of Real Estate Market Conditions Division of Supervision & Regulation Policy & Supervisory Studies Group June 11, 2007 Chairman Briefing Board of Governors KC Conway, MAI
How did this real estate crisis happen – 2008? Did it really turn that fast? Should it have been expected? We had a lot of demand being generated from factors not tied to JOBS: i) investors; ii) speculators; iii) subprime mortgages. Population Growth, Baby Boomers, Gen X, Gen Y Securitization, Immigration Loan Servicing Existing Homes Carrying Costs Employment, Income, Finished Inventory Demographic Interest Rates, Alternative Draws on Investments Lending Lines Economic Starts Loan Payoffs Liquidity Construction Supply Demand Owner Cycle Occupied Developed Lots Raw Land Home Sales Affordability Underwriting Recent Price Appreciation, P&C Insurance, Construction Property Taxes, Loans NINJA Loans (No Income, No Job or Ability to Pay) Cost of Living, Credit Scores, Acquisition Exotic Mortgages, Liar Loans, Loans Second Mortgages NINA Loans We had a lot of Supply ramped up to meet this DEMAND that can’t stop on a dime. Condo Conversions CRE Loans Investors, Federal Reserve Bank of Atlanta – Supervision and Regulation Flippers
2009 - Before you can jump back into the water, you have to be certain that the sources of contamination that polluted the market have been “cleaned-up.” Investors and speculators looking to increase their wealth harvest. Investors (blindly buying mortgages based on Rating Agency ratings. Wall Street & Securitization Congress (just increase home ownership) & Bank Regulators. Rating Agencies supposedly keeping an eye on everything Appraisers just looking at values from the surface fishing for “comps” to support any value. Home Owners: Big and small, they are all impacted now! Predatory lenders and “non-bank” subprime lenders with no oversight. Credit or equity impaired borrowers seeking the American dream of home ownership Key Note: We need to understand this is a COMPLEX problem, and all sources of contamination need to be addressed!
2010: Distinguishing a “False Bottom” from a “True Bottom” It may look like a bottom, but is it the right kind of bottom? COLD……….…..getting warmer………………..….HOT
Before the 2013 Reading, Let’s Start with a Review of 2012 Report Card on KC’s 2012 Predictions ... 4 out of 5 or 80%. • U.S. GDP would Grow by 1.5% - 2% • Home Prices to bottom-out in 2012 • Warehouse to be a Star Performer • Overall CMBS DQT to surpass 10% r X Cap Rate Compression would end.
For 2013, read the letters in KC’s Eco. Alphabet Soup. Look for direction outside Governmental data in places like NAHB, ONEI… MSA-level Job Gr. B’ham ranks #61 & among top 25% of all MSAs NAHB Improved Mkt Index Housing Recovery is real. AL has 5 MSAs on the list TX leads with 18, then FL with 15 ONEI – On Numbers Eco Index by Am Biz Journals. Quantify “Recovering MSAs” B’ham ranked 48th – In the top-50 Rail Time Indicators by Association of Am. Rail Roads Company 10(q)s Earnings reports are a treasure trove of info. Why FED doesn’t use in Beige Book is a mystery to me. Dodge Pipeline New Construction (Familiarize yourself with new supply to jobs ratios) MF is 8-9 jobs : 1 new MF Journal of Commerce An easy/cheap way to keep up with Ind’l, Ports, etc.
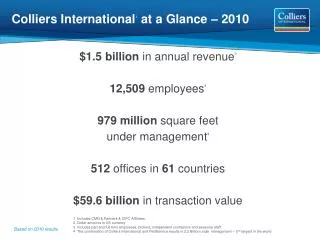
Birmingham & AL by the Numbers / Rankings Both are rising in key areas, and breaking into the Top-10 & 50 rankings. Top-10: Foreign Tr. Zone Imports & Exports. Top 10: Colliers Port Rankings “The Up & Comer” Port Top-50: Latest On Numbers Eco.Index
Those kind of numbers explain why AL is a rising AFIRE! Note: 4 of the 5 U.S. cities are all key port markets; & Ind’l R.E. #2 prf’d property
MSA-level Job Growth The SE & Gulf States are Producing Jobs B’ham ranks 61st (4,500 jobs Q3’11-Q3’12)
MSA-level Job Growth: B’ham ranks among top-25% MSAs for Jobs
NAHB’s Improved Housing Markets The Recovery is Broad-Based – note the Gulf port & SE mfg MSAs A post 2007 peak of 201 MSAs make the Dec ‘12 list
Housing Recovery will stimulate sub-office, retail & warehouse demand • Yr-End NAHB IMI • AL has 5 MSAs on the list. • TX has most MSAs with 18. • FL ranks #2 among all states with 15 • CA ranks #3 (14) • Recovery in housing will drive renewed demand for all types commercial real estate in the suburbs – neighborhood retail & professional services and small-bay, multi-tenant industrial by contractors & suppliers.
Recovering Markets – ONEI November Rankings Birmingham ranks 48th – Among the Top-50 MSAs r
Rail Time Indicators – Manufacturing & Trade Forget ISM, Empire State Mfg Index & FED Mfg Surveys – go to the source! Q. Why did rail cars in storage rise at YE? A. Impending ILA E-Coast port strike.
Dodge Pipeline: New Supply is Distribution & Logistics Centers • Ind’l U/C 2013 • 32.1 msf • (not a lot) • 8 states=45% of all constr. • GA #1 • TN #2 IN #3 • 75% Build-to-suit or large new D-Ctr & Logistics Ctr • No “Spec” risk in Ind’l
What is the Crystal Ball indicating for 2013? Beware of Q1, but be prepared for a robust 2H2013. Industrial: Ports will remain an imPORTant story! Port Labor Strife not done – Feb 6, 2013. Leasing activity remains robust Dearth of new constr & assets for sale. GDP: Pulls back to 1% or less in 1H2013, but Rebounds >2% in 2H2013 (No “Cash for Clunkers” or housing tax credit artificial stimulants). Office: ICEE office MSAs still hot. Recovery in housing will add to suburban absorption. ½ the 71.5msf of new office construction is Med Office Employment: Focus on Labor Participation rate (63.6%), U-6 (14.4%), & expect another year of 153k/mo. job growth U-3 could drop to 7% just on workers losing Unempl. benefits. MF: Overbuilding Risk is exaggerated Too much in just a few MSAs (DC) TX is OK: 1 unit : 9.2 jobs in 2012 Interest Rates: Get ‘eer done in 2013! 2nd U.S. Debt downgrade >50% FED balance sheet @ 20% US GDP Monitor commodity prices. Housing: The recovery is real! NAHB IMI > 200 markets. US Census Housing Occupancy (50 MSAs 90% to 96%)
r www.colliers.com/US/Colliers_Port_Analysis_NA_Aug-2012 www.colliers.com/us/insights CRE.org/Publications/rei_absdetail.cfm?lid=1897&lparent_id=1892
How well do you know the U.S. Ports? Colliers recognizes 10 ports 2X a year for distinction beyond size r www.colliers.com/US/Colliers_Port_Analysis_NA_Aug-2012 www.colliers.com/us/insights
How AL needs to be thinking about Port of Mobile Charleston is a case-study on the State-wide Eco Impact of a P-PMX port
Intermodal, Intermodal, Intermodal … it means Industrial Now Turns Especially to Rail to Move Ocean Distribution Across Land
Office Space Trends Note: The old ratio (growth in office employment means X square feet of office absorption) is out the window. The open space architecture is moving the space per employee ratio from 1:300 to 1:250 to 1:200. That means a 20% growth in office employment = no net new absorption. Source: Colliers Atlanta 25
Office Space Trends: ICEE is overtaking FIRE Jan 23, 2013 Chicago fire: Building turns to ICE after fire. 27
The Multi-Family Perspective Construction Activity & Costs Vs Vacancy & Cap Rates. • Is new construction overheating? • New Supply under construction or in lease-up approximates 2007 activity. • Are higher costs being rationalized by Cap Rate compression and unrealistic rent growth? The cost per unit of new construction has increased 40%.
The Multi-Family Perspective A recent record MF sale in Denver is a warning sign for hot MF MSAs.
Risks: • Congress/political dysfunction leads to 2nd Debt Downgrade • ILA Port Strike Impacts East & Gulf coasts ports February 6, 2013; NW Grain ports in Spring & West coast ports at Yr-End • End of Bernanke Fed in 2013 - Impact on interest rates & QE • Opportunities: • Housing – Monitor NAHB IMI. A surprise stimulant to “small-space” warehouse users, like building contractors & suppliers. • Job Gr in secondary MSAs fueled by ICEE sectors. • Industrial – especially port & inland distribution MSAs where retailers are remaking their supply-chains. Thank You K.C. Conway, MAI, CRE Exec. Managing Director, R.E. Analytics Colliers International KC.Conway@Colliers.com