Download
1 / 136
1.36k likes | 1.52k Views
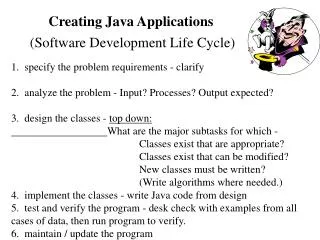
Designing and Creating applications built on R. Richard Pugh, Andy Nicholls & Chris Campbell 23 rd October 2012. Thank you for the invitation to speak tonight. Richard Pugh Principal R Consultant & Co-Founder. Andy Nicholls Senior R Consultant. Chris Campbell Senior R Consultant. Agenda.

E N D
Designing and Creating applications built on R Richard Pugh, Andy Nicholls & Chris Campbell 23rd October 2012
Richard Pugh Principal R Consultant & Co-Founder Andy Nicholls Senior R Consultant Chris Campbell Senior R Consultant
Agenda • Who are Mango Solutions? • Why Build Analytic Applications on R? • Formal R Application Development • Case Studies • The R Community • Discussion
Overview of Mango Solutions • Private Company formed in 2002 • Global Team of ~70 • Cross-Sector Software and Services • ISO 9001 Accredited
Located here ... Bath, UK London, UK Shanghai, CN Basel, CH
The Beginning: October 2002 • Started by 2 ex-Insightful colleagues • Sales Guy (BO, Cognos etc) • Techy Guy (S+, SAS, R etc) • Idea to deploy predictive analytics to business users
Why Mango? • Early awful ideas • DataStatz • Stats Entertainment • VizUStat • Stats2U • In the end, named after my colleagues cat
What we do? R Training Code Creation Consultants Validation Support
What we do? Developers Consultants Analytic Application Development
Mango Key Industries • Mango work across sectors: • Pharmaceuticals • Mango Imaging • Finance • Energy • Sensory
Why Analytics? • Analytics can help people answer all sorts of questions • I believe there is no company in the world today who cannot benefit from analytics in some way • More and more people are realising it
Who is a good driver? What bonus should I pay? How do we win more games? Will someone like this? When might this break? What are they likely to want?
Why build Analytic Applications? • 3 key reasons we see: • To deploy analytical tools to decision makers • To make an analysts life more efficient • To add rigour to an analysts workflow
Deploying Analytics • Adding analytics into a business process can mean more informed decisions can be made • Complex analytics shouldn’t be attempted by non-analysts • Means there is a communication between the decision maker and the analyst
Deploying Analytics • If we build an application which … • is easy for the decision maker to use • contains the correct analysis to apply • communicates analytical results in suitable manner • … this leads to some major benefits!
Benefits for the Analyst Benefits for the Decision Maker No need to wait for information Can perform “what if” analysis Decision not dependent on analyst availability Less need to perform often-repetitive tasks Comfortable that the “right” analysis is being run Can get on with more strategic things?
Analytic App Structure User Interface Analytic Outputs Analytic Engine Data Storage Data Code Mgment Analytic Code
Why build Analytic Applications on R? Building applications requires installing analytic engine on desktops, servers, clusters, clouds R is license free Building analytic applications involves integrating an analytic engine with other technologies (data sources, UI etc) R’s open nature means it can be readily integrated
Why build Analytic Applications on R? We want a programmable engine so that it can be readily extended (i.e. no black boxes please) R can be extended by the developer as needed We often want to be able to deploy new algorithms and techniques as they become available R is rapidly developed
Formal R Development • Creating sophisticated analytic applications requires a formal development approach • This mostly means taking standard development practices and applying it to analytics • Mango’s formal R development procedures and structure has been evolving since its inception ~2004
Issue Tracking Requirements Quality Manual Project Mgment Behaviour Driven Dev Procedures R Coding Standards StatET runit roxygen2 mangoUtils Continuous Integration Code Review Review board Knowledge Mgment
Issue Tracking Requirements Quality Manual Project Mgment Behaviour Driven Dev Procedures Coding Standards StatET runit roxygen2 mangoUtils Continuous Integration Code Review Review board Knowledge Mgment
Issue Tracking Requirements Quality Manual Project Mgment Behaviour Driven Dev Procedures R Coding Standards StatET testthat roxygen2 mangoUtils Continuous Integration Code Review Review board Knowledge Mgment
Case Studies • These are examples of applications we’ve built that use R in some way • We’re presented a range of information about each including: • Business Reason for the application • Technical Approach • Some Technical Detail where applicable • Things that worked well / things that didn’t
Case Studies • Ranges from information we can fully disclose to only being able to say vague things about the customer • Only so much info we can give today – please see us after or contact us and we can step through things in more detail Richard Pugh = rpugh@mango-solutions.com Andy Nicholls = anicholls@mango-solutions.com Chris Campbell = ccampbell@mango-solutions.com
Case Studies • PKPD Web Modelling Platform • M&S Workflow Platform • Non-Compartmental Analysis Application • Coffee Blend Optimisation Tool • Pipeline Corrosion Forecasting Application • Backtesting Application
Case Study: PKPD ModellingOverview • Pharmacokinetics-pharmacodynamics (PKPD) is the study of the manner in which a drug transitions through the body and its impact on a target disease • PK is highly complex, involving sophisticated non-linear mixed effects modelling approaches
Case Study: PKPD ModellingOverview • Modellers use “NONMEM” software in order to fit these models • Inputs and outputs to NONMEM are a mixture of structured and unstructured textual files • R often used to analyse the outputs in order to assess model fit (see “xpose4” library)
Case Study: PKPD ModellingOverview • PKPD is an evolving and exciting area, with modellers needing flexibility and a variety of tools • However, being within life sciences, rigour around workflows is key in order to satisfy regulatory requirements
Case Study: PKPD ModellingThe Challenge • Build a modern modelling platform that provides rigour whilst allowing the modellers the flexibility they need • Range of technical users from “everything is a shell script” to “which button do I click” • Execution of third party tools (NONMEM, R, SAS, PsN, …) in a controlled manner • Interface to generate reproducible graphics, tables and reports
Case Study: PKPD ModellingThe “R” bit • Where does R fit in? • Many users use R and want to be able to develop scripts and execute them on an internal grid • R used as the graphics engine to support the model evaluation and reporting processes • Users want to be able to execute R interactively with objects in their project
App Server The App Execution Server(s) RPoolMgr MIF Queue MIF Cloud + Others Grid + Others
Case Study: PKPD ModellingWhat is a “Report Item Definition” • Definition of a graph or table that can be executed from Navigator • Consists of snippet of R code, options that may be presented to the user, required columns, and a few other bits • Can be used in a number of situations in the application • Originally XML then stored in Db (XML shown to give a feel for structure on next slide)
Command Definition Report Options Source Data
The App / RPool Manager Text Data Table Graph xml Method xml Method xml Method xml Method Text Item Data Item Table Item Graph Item Data Frame Table Object Character Graphics
Version Control Command Definitions Command Results Execution Engine (Java)
Case Study: PKPD ModellingHow are “RIDs” used? • Created, managed by Super Users (under version control) • Called in a few places in the application: • Directly (create this graph with this data) • In “Run Views” (reports) • In “Comparison Views” (reports that compare models) • In “Template Reports” (tagged docx files)
Case Study: PKPD ModellingOutcome • The app in general was a big success • The “R” part was created as a separate service that we have since reused in a number of other applications (e.g. Lloyds Risk Platform!) • Shame that regulatory rules forced some design which we’re now building alternatives too • Next: interactive graphical presentation
Case Study: M&S Workflow PlatformOverview • Exciting project for major pharmaceutical company • Possibly the closest we’ve come to deploying an analysts workflow in a scalable platform • Hundreds of pre-clinical (animal) studies are run by a team of ~400 scientists • Analysis performed by roughly 15 advanced modellers • Outcome: most studies not analysed!
Case Study: M&S Workflow PlatformThe Challenge • Idea to create a truly scalable platform to allow bench scientists to run their own analysis • Modeller publishes an analysis “protocol” containing analysis paths, code, and support documentation • Desktop application pulls from central set of protocols and “derives” the interface which is presented to the user • Modelling can put in checks to ensure things look right (e.g. data is of right format, model fit is particularly poor but user seems keep to create predictions from it)
Case Study: M&S Workflow PlatformThe Solution • Eclipse RCP application executing R and NONMEM scripts on an internal LSF grid, with protocols and code held in SVN • Generated workflow “protocol” definition (XML) detailing possible paths in a step, linked to R scripts and NONMEM model code with corresponding dialog • Built “Protocol Developer” Eclipse interface onto repository • RCP application derives analysis paths, UI, options and commentary to guide the end user