Download
1 / 34
340 likes | 501 Views
OAPd. WINGS-SPE Analysis of substructures in nearby galaxy clusters. Antonio Cava Physics Department - University of Milan INAF- Astronomical Observatory of Padua. Antonio Cava. IAC - La Laguna 30-01-08. OUTLINE. DATA the WINGS project (WINGS-spe) redshift measurements

E N D
OAPd WINGS-SPEAnalysis of substructuresin nearby galaxy clusters Antonio Cava Physics Department - University of Milan INAF- Astronomical Observatory of Padua Antonio Cava IAC - La Laguna 30-01-08
OUTLINE • DATA • the WINGS project (WINGS-spe) • redshift measurements • comparison with literature (NOAO/NED) • SUBSTRUCTURES IN GALAXY CLUSTERS • Intro and methods • 2D-substructure analysis – DEDICA • (2+1)D-substructure analysis – DS method • density and VD profiles (+ X-ray) • A case study: A3558 • CONCLUSIONS AND FUTURE WORK IAC, 30th January 2008
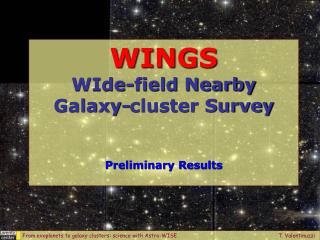
INTRODUCTION Wide-field Nearby Galaxy-cluster Survey A Wide-Field Multiwavelength Survey of Galaxy Clusters in the local Universe 77 clusters B,V bands WFC@INT north WFI@MPG south • WINGS-OPT 47 clusters 36007000 Ǻ WYFFOS@INT north 2dF@AAT south • WINGS-SPE ~50 clusters J,K bands WFCAM@UKIRT • WINGS-NIR ~20 clusters Halpha band WFC@INT ~1 square degree • WINGS-HAL • WINGS-LBC LBC@LBT ~20 clusters U survey (~30’) IAC, 30th January 2008
Clusters Galaxies WINGS Scientific targets of WINGS Questions: Which are the typical features of galaxy clusters in local universe? Can be considered simple objects in the cosmological context? Can be described in a simple way in term of internal kinematics? Are they dynamically relaxed and old? global properties of galaxy clusters in the local Universe Kinematical and dynamical properties of clusters and substructures positions, local density, Lum.Func. Radius, total luminosity, geometry WINGS-spe properties of cluster galaxies in the local Universe morphology E:S0:Sp:Irr <µe>–re membership age-metallicity, SFH, environment B/D ratio Color Color grad. provide the scientific community with a local (0.04<z<0.07) benchmark for evolutionary studies IAC, 30th January 2008
WINGS-SPE The spectroscopic follow-up The project • multi-fibre spectra of 100-200 (brightest) galaxies in each cluster • selection criteria: V<20 (-16.5) 1.5/2 mag deeper than 2dFGRS/SLOAN • (B-V)<1.4 • 0.04 < z < 0.08 • intermediate resolution: 3÷9Å • spectral range: 3600÷7000Å • The WINGS-SPE sample is constituted by a subsample (47 clusters) of the WING-Survey (77 clusters): • 22 clusters for the south (2df@AAT) ~ 4500 redshifts • 25 cluster for the north (WYFFOS@WHT) ~ 1500 redshifts IAC, 30th January 2008
Measurements • Redshifts are measured using cross-correlation technique (Tonry&Davies,1979) • IRAF/RVSAO xcsao/emsao packages (Kurtz&Mink, 1998) • 15 absorption/emission templates • Visual check of the best fit • Skylines zero point calibration (up to ~ 50 km/s) • Developed pipeline to produce final catalogs • Good catalog (small errors, high reliability) • Bad catalog (rejected spectra,statistics) IAC, 30th January 2008
REDSHIFT : results • The results of the measusements (Cava et al.,2008a) are presented as: • redshift histograms • velocity diagrams (z-r) IAC, 30th January 2008
Redshift Distribution NORTH • 22 WYFFOS@WHT (Cava et al.,2008a) IAC, 30th January 2008
Redshift Distribution SOUTH • 22 2dF@AAT (Cava et al.,2008a) IAC, 30th January 2008
Overall redshift distribution About ~60% of the galaxies in the redshift catalogs have been classified as cluster members (black histogram) IAC, 30th January 2008
Data quality • Redshift measured with cross-correlation + individual check • high success rate and small errors Mean ~ 45 km/s Median ~ 35 km/s ~ 99% of the measurements have errors lower than 90 km/s IAC, 30th January 2008
External comparisons – Adding more data We have found about 1800 objects in common with the literature and 4500 objects that could be added to the final catalogs in order to increase the statistics for dynamical analysis. The total number of galaxies with redshift increase to ~ 10500 IAC, 30th January 2008
REDSHIFT : results • Spectroscopic data are used to perform analysis in two main directions: • spectro-photometric modeling (J.Fritz, B.M.Poggianti) • kinematics and dynamics of clusters and substructures (A.Cava, in collaboration with A.Biviano and M.Ramella) IAC, 30th January 2008
Spectrophotometric analysis A galaxy model spectrum is computed by adding the synthetic spectra of Single Stellar Populations (SSPs) of different ages built with a Salpeter initial mass function (IMF) with stellar masses in the range 0.15 ≤ M ≤ 120 Msun (see Fritz, Poggianti et al., 2007) (Fritz et al., 2007) IAC, 30th January 2008
Spectrophotometric analysis This will give us estimates for star formation rates and histories, as well as metallicity for the cluster galaxies from the line indices and equivalent widths measurements . These data are used to explore the link between the spectral properties and the morphological evolution in different density environments. (Fritz et al., 2007) (Fritz et al., 2007) IAC, 30th January 2008
WINGS-SPE: velocity diagrams First step in the dynamical analysis is just to look at the velocity diagrams (i.e. redshift vs clustercentric distance) to search for particular distributions in phase-space. IAC, 30th January 2008
Peculiar cases Velocity diagrams - NORTH • Membership and velocity dispersion determination Red points are those selected as cluster members according to a 3-sigma clipping selection criteria (Yahil&Vidal,77). Estimated R200 and are given for each cluster. IAC, 30th January 2008
Peculiar cases Velocity diagrams - SOUTH • Membership and velocity dispersion determination IAC, 30th January 2008
Some details : substructures Observed clusters appear as complex structures in phase-space. This kind of observations stimulate and motivate the investigation of substructures in clusters. Distributions can be multi peaked even in more “standard cases” IAC, 30th January 2008
Substructure detection • Spatial substructures • The main advantage of searching for substructures in the two-dimensional distribution of galaxies is the availability of large data sets, reaching thousand of positions for nearby clusters. The main drawback is its possible contamination from fore/background objects The methods which are commonly used to detect substructures can be grouped in three classes, detecting different kind of substructures. DEDICA-2D • Velocity substructures • In relaxed systems, the velocity distribution is expected to be Maxwellian. Therefore a non-gaussian distribution of the observed line-of-sight velocities is indicative of a non-relaxed dynamical state. However fore/background galaxies can still contaminate the velocity distribution Modified DS • Spatial-velocity substructures • The existence of correlations between the positions and the velocities of • cluster galaxies is a footprint of real substructures. Methods that make use of both positions and velocities are certainly the most reliable but also the most demanding in terms of observational data FoF IAC, 30th January 2008
Subclustering 2D - DEDICA 27 % without substructures 40 % with Nsub=1 19 % with Nsub=2 11 % with Nsub=3 3 % with Nsub=4 • The DEDICA procedure • The search for substructures in 2D space using DEDICA (Ramella et al.,2007) has the following advantages: • DEDICA gives a total description of the clustering pattern • DEDICA is scale invariant • DEDICA does not assume any property of the clusters, i.e. it is completely non- parametric Another interesting result is that the magnitude difference between BCG1s and BCG2s is significantly larger in clusters without substructures than in clusters with substructures. IAC, 30th January 2008
Subclustering (2+1)D : Dressler-Shectman method A general problem in the detection of substructures is that observations only provide the (2+1)D projection of the (3+3)D phase-space • We have used a modified version of the test devised by Dressler and Shectman (1988) sensitive to compact systems which have: • an average velocity that differs from the cluster mean • a velocity dispersion that differs from the global one IAC, 30th January 2008
Subclustering (2+1)D : Dressler-Shectman method We find that about 42% of clusters have a value of the DS parameter that indicates presence of substructures (Cava et al.,2008c). Using only ‘red’ galaxies for the analysis we find a significantly reduction (28%) of the number of substructured clusters. IAC, 30th January 2008
Subclustering (2+1)D : Dressler-Shectman maps DS maps show the presence of Substructures in velocity space
NFW projected density profile (Lokas&Mamon,01) Fitted NFW Theoretical VDP (Buote, 07) Cluster profiles Using a slightly modified version of the code of Biviano&Katgert (developed to analyse ENACS) I am now analysing the velocity dispersion and density profiles for clusters and substructures. Next step is to generate a stacked cluster to investigate more in detail the mean properties of the clusters with varying environment(Cava et al.,2008b) IAC, 30th January 2008
Subcluster detection Density, mean velocity and velocity dispersion profiles are useful tools in subclustering detection as they provide direct evidence of the dynamical influence of substructures on the galaxy clusters. About 65% of the clusters in the sample present deviations in the velocity, vdp and density profiles.
Velocity dispersions: SIGMA vs LX I’m now using the obtained global parameters (M,,R)also in connection with morphology (MORPHOT, G.Fasano & E.Pignatelli) to look at cluster segregation properties in different cases (in subs and clusters). IAC, 30th January 2008
Velocity dispersions: SIGMA vs LX • X-ray data can give important insights on the dynamical state of galaxy clusters and subclustering properties. We are now comparing the results from optical analisys of substructures with X-ray oservations. • sigma-Lx relation • thermodynamics maps IAC, 30th January 2008
X-ray data : thermodynamics maps A754 (left) and A1644 (right) thermodynamics maps: Upper left: EPIC flux image of A1644; Upper right: Best fit temperature map (keV) from XMM images; Lower left : Pseudo-pressure map; Lower right: Pseudo-entropy map. (Coutesy of M.Rossetti, Milano Univ., PhD thesis) IAC, 30th January 2008
SB T P E Gathering all togheter, a case study: A3558 IAC, 30th January 2008
Gathering all togheter, a case study: A3558 IAC, 30th January 2008
SUMMARY • reduction of the spectra • measurements of all the redshifts for WINGS-SPE • data quality check and comparison with literature • investigation of substructures: Analysis of V, VD and density profiles Study of substructural properties of the clusters in (2+1)D space (DS maps) 2D-analysis with DEDICA (density maps) Comparison with X-ray observations (TD maps) IAC, 30th January 2008
CONCLUSIONS Questions: What is a typical cluster in nearby universe? Is it a simple object in the cosmological context? Can be described in a simple way in term of internal kinematics? Is it dynamically relaxed and old? • Ongoing and Future Work • FoF analysis of substructures in 3D phase-space • determinations of global parameters characterizing subs in relation to their parent cluster • comparison with simulations • comparison with distant clusters • From our analysis we have strong indications tha galaxy clusters are very complex structures where subclustering assumes a relevant role. • Comparing the analisys with different methods we infer that the presence of subs is higher in local universe then found in earlier works (tipical values of 30%-50%, Girardi and Biviano 2002 and refs therein): • 73% from 2D-analysis • 42% from (2D+1)-analisys • 65% investigating radial profiles These observations pull us toward a view of local clusters as still dynamically ‘hot’ and young objects. A so high fraction of subs is also indicative of a ‘low density’ universe at early stages of its evolution (e.g.Buote 07) and consistent with a hierarchical evolution in the last 5-8 Gys IAC, 30th January 2008
THE END IAC, 30th January 2008