Download
1 / 10
110 likes | 184 Views
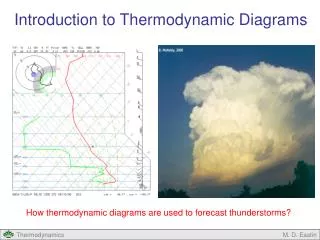
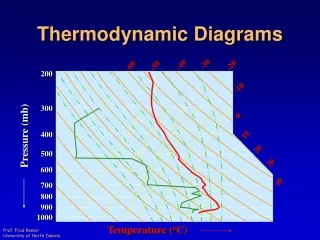
Explore how thermodynamic diagrams help identify stability, air masses, moisture levels, clouds, and atmospheric processes. Learn about Stuve (Pseudoadiabatic) and Skew-T diagrams, isobars, isotherms, and mixing ratio lines.

E N D
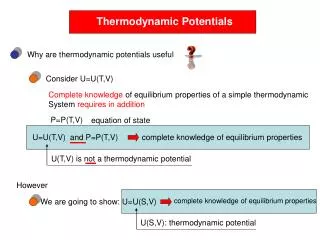
Atmospheric Soundings Plotted on Thermodynamic Diagrams • Allow us to identify stability of a layer • Allow us to identify various air masses • Tell us about the moisture in a layer • Help us to identify clouds • Allow us to speculate on processes occurring