Download
1 / 10
100 likes | 367 Views
Assembly of DNA Graphs whose Edges are Helix Axes. Phiset Sa-Ardyen*, Natasa Jonoska** and Nadrian C. Seeman* *New York University, New York, NY **University of Southern Florida, Tampa, FL. Abstract.

E N D
Assembly of DNA Graphs whose Edges are Helix Axes Phiset Sa-Ardyen*, Natasa Jonoska** and Nadrian C. Seeman* *New York University, New York, NY **University of Southern Florida, Tampa, FL
Abstract The feasibility of the molecular computational approach based on the self-assembly of branched DNA junction molecules has been demonstrated by experimentally constructing a DNA graph. Based on the algorithms previously proposed, the DNA graph chosen for construction corresponds to a prototype system for solving the 3-colorability problem. We used a k-armed branched DNA molecule to represent a vertex of degree k, and a double helical DNA molecule to represent an edge. We also incorporated four restriction sites in each long edge of the graph by means of an extra hairpin fused on to the edge via a three-armed junction. Restricting these sites serves to linearize the graph in a specific way without altering the logical part of the graph. The first step involved self-assembly of component strands to form the vertex and edge building blocks. Then self-assembly of these constructs was allowed to form the graphs, which were subsequently converted to a covalently closed single stranded circle or knot by ligation. After purification, the ligated DNA graphs were characterized. By using restriction mapping technique, we were able to prove that the DNA graphs obtained were in correct arrangement.
A 3-Colorable Graph and its Prototype for Computation • A graph is 3-colorable if it is possible to assign one color to each vertex such that no two adjacent vertices are colored with the same color. In this example, one 2-armed branched molecule, four 3-armed branched molecules and one 4-armed branched molecule are needed. • (b) The same graph was chosen for the construction. Since the vertex V5 in (a) has degree 2, for the experiment a double helical DNA is used to represent the vertex V5 and the edges connecting V5 with V1 and V4. The target graph to be made consists of 5 vertices and 8 edges. (c) The target graph in DNA representation.
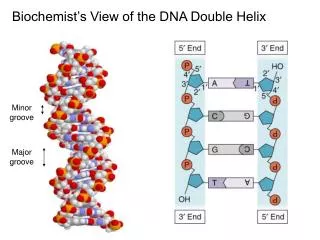
Sequences of Representative Vertex and Edge Units The vertex V3 is shown here with the three connecting edges: E2, E5 and E7. A strand of DNA is represented by a string of nucleotide sequences: A, T, g and C. The 5’end of a strand is located at the terminus of the single-stranded extension of an arm. The names of neighboring vertices are indicated at the terminus of each arm of a vertex, and at each end of an edge. Note that bulges of two T’s were added to the junction where the arms meet to increase the flexibility. The number of nucleotides at the sticky-end of an arm (shown in bold type) varies from 6 to 8 nucleotides depending on whether the short or the long arm is connected to such an arm of a vertex. Shown in the inset is the biotin-modified version of E7 introduced for restriction mapping experiments.
Non-Denaturing Gel Characterization of Self-Assembled Units (a) The gel (12% acrylamide/bis (19:1)) was run at room temperature. The DNA was stained using Stains-all dye. Lanes 1 contains linear markers. Lane 2 to 14 contain the annealed vertices and edges. The names of the species characterized are indicated on top of each lane. With exception for V1 and V4, all bands were well-defined, with no lower bands or upper bands indicating the complex formed well. The smearing seen in the two lanes that contained V1 and V4 is likely to be a result of a limited degree of self-association. (b) Self-Assembled Vertex and Biotin-Modified Edge Subunits. This is a 12% acrylamide/bis (19:1) non-denaturing gel that was run at 30C. As in (a) the names of the species characterized are indicated on top of each lane, with B superscript denoting the biotin-modified units. Note that at this moderately elevated temperature used to run this gel, the smears seen earlier for the bands corresponding to V1 and V4 become lessened.
Topoisomerase I Characterization of Putative DNA Graphs Two of the topologically closed ligation species G1 and G2 were purified separately from two distinct off-diagonal bands on a two-dimensional Fischer-Lerman 100% denaturing gel (inset), and treated with E. coli Topoisomerase. Lane 1 contains linear standard markers. Lane 2 to 4 contain G1, where lane 5 to 7 contain G2. Lane 2 and 3 contain untreated controls that were stored at -20C (lane 2) or incubated in buffer at 37C overnight without topoisomerase (lane 3). Lane 4 contain the material treated with topoisomerase I. Incubating materials in lane 2 or 3 with topoisomerase I followed by phenol extraction resulted in an extra band characteristic of the untreated materials of the other species as seen in lane 4. Similarly, lane 7 shows that topoisomerase I treatment of materials in 5 or 6 produced an extra band that ran with the same mobility as the untreated band in lane 2 and 3. This observation is consistent with the hypothesis that there is a topoisomer relationship between G1 and G2.
Characterization by Restriction Mapping (a) Individual Cleavages of the Putative Graphs by Four Restriction Enzymes. The untreated materials shown in lane 2 and the exonuclease III treated materials shown in lane 3. In the following sections, the results of restricting the putative graphs with the following restriction enzymes are shown: PvuII (lane 4); EcoRI (lane 6); XhoI (lane 8); and PstI (lane 10). In each case, aliquots of the restricted materials were subjected to exonuclease III digestion, and the results are shown in the lanes to the right next of the original restricted products (lane 5, 7, 9 and 11). (b) Final Restriction Mapping Analysis. This is the analysis using the enzymes XhoI and PvuII. The first section (lane 2-7) contains the restriction fragments obtained from simultaneously digesting the graph with two enzymes: Pst I and EcoRI . The expected size of this fragment is 923 nt. The second section (lane 8-10) contains the shorter restriction products (135 nt) after the double-digestion by the same set of enzymes. Both 923 nt and 135 nt fragments were first denaturing gel purified prior to the restriction analysis shown in this gel. Lane 2 and 8 contain untreated controls. Lane 3 contains the material digested with Xho I. Lane 4 contains the products of single digestion by PvuII. Lane 5, 6 and 9 contain the products after treating with both enzymes simultaneously. Lane 6 contained the double digested products treated with streptavidin beads. Finally materials treated with Pst I and EcoRI as the controls to show that no sites for these enzyme are present, are shown in lane 7 and 10. A cyclic 336 nt was added to each lane to indicate lack of endonuclease contamination (the arrow with label). Shown beneath the gel is the diagram outlining the steps for obtaining the restriction fragments, as well as the following restriction steps.
Round-the-Clock Mapping (a) Similar analysis as shown in (b) of preceding figure using the enzymes: Pst I and PvuII on the fragments (838 nt for the long and 220 nt for the short ones) generated by first double digesting the graph with EcoRI and XhoI. (b) Similar analysis using the enzymes PstI and EcoRI on the fragments (674 nt for the long and 384 nt for the short ones) generated by first double digesting the graph with XhoI and PvuII. There are three (c) Similar analysis using the enzymes EcoRI and XhoI on the fragments (785 nt for the long and 273 nt for the short ones) generated by first double digesting the graph with PstI and PvuII.
Conclusions We have demonstrated that a DNA graph molecule whose edges are represented by the helix axes can be made by self-assembly of the branched DNA molecules and conventional double helical DNA. The graph constructed was a prototype system where only unique vertices and edges were designed to form a graph, with no algorithms implemented for computation. For a practical system where computation can be executed by the self-assembly, additional variation in both the edges and vertices encoding for inputs must be present in the assembling tube from the beginning. However, once the self-assembly is allowed to completed, the same approach as indicated here can be applied to read out for possible solution. The advantage of using three dimensional graph structure in computation is that if a solution to the problem exists, its presence is directly manifested by the successful construction of the graphs. Thus the same approach used in this study, in principle, can be applied to obtain the information about the existence of the solution.