Download
1 / 52
520 likes | 606 Views
Challenges and Choices for the Top Team in Relation to Shareholder Value Hilary Collins. Infrastructure. People and Alignment. Focus, Agendas, Business Cases, and Decisions. Financial and strategic visibility and performance. Objectives and Targets.

E N D
Challenges and Choices for the Top Team in Relation to Shareholder Value Hilary Collins
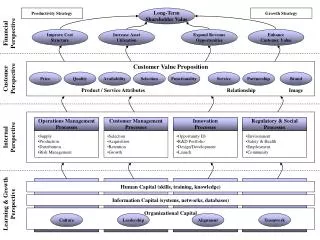
Infrastructure People and Alignment Focus, Agendas, Business Cases, and Decisions Financial and strategic visibility and performance Objectives and Targets Challenges and choices for the top team related to shareholder value • Making trade-off decisions (now vs future; where to allocate resources; etc) How should we structure the business? How should we allocate roles and responsibilities to senior managers? What management information is needed? How will that be delivered? How do we develop the management capabilities and motivation needed to deliver superior returns to shareholders? How do we get the organisation to work together at different levels? What do we want managers to focus on now? How should we solve the problems and grasp the opportunities we face? How should we take big decisions? How should we measure and manage financial performance? How should we think about strategy? What are the objectives of the business? What drives the value of the business? What levels of performance do want to deliver and how will we measure that performance? How will we set targets for parts of the company and for key individuals?
CVI Business Framework • The horse will run as fast as it’s slowest leg allows Objectives and Targets Financial and strategic visibility and performance Infrastructure Focus, Agendas, Business Cases, and Decisions People and Alignment
“We are in business to maximise the returns to our shareholders over time” Consequences for: “The way we do things around here” • We set and use performance aspirations and targets based on measures that are relevant to our shareholders • We strive to get and use good visibility of the locations and sources of value creation and destruction in various ways across our business. • We focus our managers on the issues and opportunities that will have the biggest impact on the value of the business • We align the work of managers at different levels and in different parts of the business with shareholder value • We create robust value-based business cases to help us to take the big decisions • We equip and motivate our organisation to manage for value • We develop value-based managers What is “managing for value”? • A distinctive approach to managing businesses “Lloyds was a VBM pioneer in the mid-1980s and went on to create huge value for its shareholders. Indeed, its share price doubled every three years for about 15 years. Chairman Brian Pitman has no doubt where the credit lies: “Doubling the share price every three years can’t be accomplished by incremental change; it requires major change and scrapping the old ways of doing things...Managing for Shareholder Value (Lloyds VBM programme) was the driving force behind our success”
Overview of Managing For Value (MFV) • The development of MFV over time • MFV as a concept has been around since Adam Smith • But it has been operationalised only in the last 20 years • There are very few businesses (and even fewer consultancies) which have a good understanding of how to operationalise MFV • MFV is a rigorous and systematic management discipline which often requires decisions to be made which are seemingly at odds with “traditional” management thinking • The number of MFV exemplars has been small but it is growing rapidly, especially in the Anglo-Saxon area • “The Wealth of Nations”... • Late 1970’s • “We measure, therefore we know” • MFV = valuation using discounted cash flow techniques • The 1980’s and 90’s • “Strategy drives financial performance” • MFV = strategy from a value perspective • 2000 – • “The whole business needs to be aligned with value” • MFV = holistic approach to management focused on shareholder value
Banking Lloyds TSB Bank of America Bank of Montreal ABN Amro Standard Chartered Barclays HSBC Beverages Coca-Cola Cadbury Schweppes Diageo Entertainment Disney Property Information Reuters BT Slough Estates Retailing Boots Group Coles Myer Nordstrom J Sainsbury Ahold Metro Manufacturing Boeing Champion GE Alcan Amcor Chemicals Dow Chemical BP Pharmaceuticals Insurance Services Prudential Centrica Roche Some well-known businesses have attempted to become value-based (in various ways) • Many industries; USA/UK predominance (up to now)
Market Value Added The wealth that has been created or destroyed by management since the start of the company Financial Times MVA - any value that managers have created (above and beyond the money which has been invested) (£3bn) UK plc number of shares (2bn) x the share price (£5) = the “market capitalisation” (£10bn) The money that investors (and managers) have invested (reinvested) in the business since it started (£7bn) Shareholder value: key external performance metric 1 • Market Value Added (MVA) represents wealth created (or destroyed) since the founding of the company Market Book MVA represents the current speed of the “Management treadmill”
Shareholder value: key external performance metric 2 • Total Shareholder Returns (TSR) is an annual measure of return to shareholders (Share Price(eoy) - Share Price(boy)) + Dividends per share Total Shareholder Returns (TSR) = Share Price(boy) = Share Price Appreciation plus Dividend Yield • Share prices are driven by investors’ expectations of future cash flows (or economic profits) • “Meet expectations” = deliver cost of equity capital (ke): share price stable : MVA = 0 • “Positive surprises”: share price rises: increase in MVA • “Negative surprises”: share price falls: decrease MVA • Short-term results (positive or negative surprises) change expectations of future performance and can result in large swings in share prices • Investor expectations need to be managed very carefully • But financial performance is the only thing that matters in the longer term Shareholders TSR represents the speeding up or slowing down of the “Management treadmill”
CEOs are coming under increasing pressure to deliver TSR performance, especially in Europe and Japan • CEO’s who do not deliver superior TSR’s are being fired both more often and faster than before The 2500 largest quoted companies worldwide were studied. In these companies, 253 CEO’s retired, died or got fired in 2002 39% of these CEO departures appear to be “firings” caused by unacceptable performance, up from 25% in 2001 CEO’s who were dismissed in 2002 had generated median shareholder returns 6.2 percentage points lower than those generated by CEOs who retired voluntarily “Failing” CEO’s seem to be getting fired sooner * “CEO Succession 2002 – Deliver or Depart” Booz Allen Hamilton, strategy+business magazine, summer 2003
Infrastructure People and alignment Focus, agendas, business cases and decisions Financial and strategic visibility and performance Objectives and Targets Infrastructure People and Alignment Focus, Agendas, Business Cases, and Decisions Financial and strategic visibility and performance Objectives and Targets Challenges and choices for The Top Team • How can you get consensus around the right Governing Objective? • Do we have consensus on what drives the value of the Group on the stock market? • What is the governing objective for the Group? • What are we trying to maximise? • How do we trade-off competing objectives when we make big decisions? • What is our performance aspiration for the Group? • Relative to a set of competitors or an index? • Other? What terms should we use to express that aspiration? What financial performance over time is likely to be required to meet this aspiration? Is there a gap between this level of performance and our current forecasts? How do we cascade our performance targets in ways that are meaningful for the main operating companies and then further down to line managers? Do our KPIs match well with the drivers of Group value? Have the KPIs been cascaded appropriately?
Infrastructure People and alignment Focus, agendas, business cases and decisions Financial and strategic visibility and performance Objectives and Targets Executives are subjected to pressure from many other stakeholders • How should the trade-offs be made? Customers Employees and unions Personal needs Government Analysts and the media Banks (and advisors) Environmental groups Shareholders (large and small) Suppliers
Infrastructure People and alignment Focus, agendas, business cases and decisions Financial and strategic visibility and performance Objectives and Targets And internal functional priorities and preferences often conflict with each other as well • An illustration... Sales “Maximise revenue growth” R&D “Maximise the technical differentiation of our products” Marketing “Maximise market profile and awareness” Production “Lowest cost of production” Purchasing “Minimise the cost of purchased goods and services” Finance “Cost cutting” Logistics “Maximise availability of product with lowest stockholding” IT “”Do what our users want/need” “Do the sexy stuff”
Infrastructure People and alignment Focus, agendas, business cases and decisions Financial and strategic visibility and performance Objectives and Targets Market share-driven behaviour and business models Market share goals and targets Market share objectives “Profit”–driven behaviour and business models “Profit” objectives “Profit” goals and targets Multiple objectives Confused behaviour and business models Multiple goals and targets Shareholder Value-driven behaviour and business models Shareholder Value objective Shareholder Value goals and targets Businesses need a clear Governing Objective to guide decision-making • The Governing Objective dictates goals, targets, management decisions and performance Governing Objective Performance Goals and Targets Management Behaviour, Decisions and Business Models The “objective function” of the Group and each business unit - the primary decision criterion The type and level of performance goals which are used to direct managers towards achieving the governing objective The decisions managers take about where and how to compete in order to achieve the performance goals
Infrastructure People and alignment Focus, agendas, business cases and decisions Financial and strategic visibility and performance Objectives and Targets Stakeholder Revenue Customers - COGS Suppliers - Wages Employees - Overheads Employees and Suppliers - Interest Providers of debt - Tax Government/community - leaves if there is anything left! - funds for shareholders “Maximise value over time” is what the owners of most – if not all - publicly-quoted businesses are paying their managers to do. “Maximise value over time” is the best Governing Objective for all stakeholders • It is the only Governing Objective that facilitates decision-making which is forced to consider the impact on all stakeholders • Companies must balance the interests of its stakeholder groups (employees, customers, community and shareholders) to maximise value over time • Company profitability is directly linked to whether or not it has an advantage over competitors on its offer; its economic costs; and/or its pricing • Therefore, the intent of a company which maximises its value has to be to treat its employees, customers, and community in a manner that improves its relative competitive advantage • And value maximisation is unlikely to be sustained if a company chooses strategies, organisational structures, or decision-making processes that: • cause the customers’ perceptions of the company and its offer to deteriorate over time • cause the company’s relationship with employees and the community to weaken over time • diminishes the attractiveness of its offer to customers over time • incur excessive costs relative to competitors over time • So our view is that “maximise value over time” is a win-win game for all stakeholders over time – increments to total welfare can only come from creating wealth
Infrastructure People and alignment Focus, agendas, business cases and decisions Financial and strategic visibility and performance Objectives and Targets Competing Governing Objectives are sometimes adopted either explicitly or implicitly • Other Governing Objectivesmay or may not be well aligned with maximising value • Financial Objectives • Maximizing earnings or eps growth • Minimizing total cost • Stabilizing earnings over a cycle NOPAT Misguided view of customer satisfaction vs profit Highly Profitable Customer Group • Strategic Objectives • Maximizing market share • Maximizing customer satisfaction • Building brand equity Typical Customer Group Charge for Capital Unprofitable Customer Group • Organizational Objectives • Maximizing company size • Balancing “stakeholder” interests Customer Satisfaction While achieving these objectives may be consistent with maximising value, pursuing any one as the primary objective is unlikely to maximise value over time
Infrastructure People and alignment Focus, agendas, business cases and decisions Financial and strategic visibility and performance Objectives and Targets Managers’ views on the financial drivers of shareholder value have changed over time • These changes have also changed the focus of – and priorities for – line managers over time Earnings focus (“history”) • Based on accounting measures and conventions • Earnings; EBIT; EBITDA; P?E ratio • Earnings are not the same as cash flow • Easy to manipulate • Excludes capital and it’s costs • Excludes risk • Excludes time value of money The value of the business is driven over time by the market taking the current earnings per share (EPS) for the business and multiplying that by a P/E ratio which is based on market expectations of the future growth and quality of those earnings Therefore, managers should focus on finding and implementing the strategies that will maximise earnings and earnings growth. Return on Assets focus (“1980’s on) • Emphasised the use of return metrics such as ROI, ROE, RONA, ROCE • Same issues as Earnings, plus calculation of capital base • Excludes growth - can stunt value creation There is an emerging awareness of the need to use capital effectively. Ratios such as return on assets are used to take some account of capital. However, the measures that underpin decisions are still based on the accounting paradigm. Managers are driven to hit target (or hurdle) rates of return Discounted cash flow focus (“more recent”) • Based on economic measures and conventions using cash flow • Or using other metrics such as Economic Profit; Cash Value Added; etc • Demands good forecasts of future performance The value of the business is driven over time by the market’s expectations for the future cash flows (or EP’s) the business will generate which are discounted back to the present at a cost of capital. Therefore, managers need to focus on finding and implementing the strategies that will maximise the NPV of cash flows or EP’s. In addition, they should find ways of reducing the cost of capital.
Setting performance targets • A value-based approach to setting and cascading aspirations and targets • Group sets out Value Goals (eg double value in 5 years;or position in the peer group) • Group figures out the financial performance likely to be needed to achieve the Value Goals (stream of EP into the future) • Group cascades the Value Goal requirements (EP over time) down into the OpCos eg: • top down: "share the pain out" based on sales revenue; or EP; or assets employed; or some such algorithm • "share the pain out" based on top management judgement • bottom up: careful consideration of Market Economics and Relative Competitive Position for each OpCo; plus consideration of the likely impact of each strategic management agenda • a combination of the above • Why cascade? • Because the value of the Group is the sum of the value of its current OpCos • And the Group needs to calibrate each OpCo on the amount of stretch in performance it needs to achieve to contribute to Group aspirations • which means that each OpCo needs to have the right Issues on Agendas, etc • What then? • Each OpCo reviews its issues/strategy in the light of their share of the Value Goals • They rework their issues/agendas in an attempt to reach these goals • When they are convinced (and the Group CEO is convinced) that the value-maximising actions are being taken then these actions form the core of the business plan and set the performance targets against which performance is monitored • If there is a gap between the Group Value Goal and the sum of the OpCo performance targets (and there probably will be such a gap) then: • the OpCos are asked to look again at their issues/agendas (although his runs the risk of becoming unrealistic if the earlier work on issues/agendas has been done well) and/or • the Group has to find ways of plugging the gap by changing the portfolio of OpCos
Calibrating managerial expectations…. • External Measures • TSRs relative to a peer set of companies • Time to double shareholder value • Financial Targets • Growth of EP over time • Growth of revenue and capital • ROC or ROE • ECF or TCCF • Strategic Targets • Market share • Like-for-like growth • Price position • CBR or CSI • Economic cost position • Organisational Targets • Market share • Like-for-like growth • Price position • CBR or CSI • Economic cost position Internal proxies for external measures Aligning external aspirations with internal targets • The linkage between external measures of shareholder value creation and internal measures of performance
Infrastructure People and alignment Focus, agendas, business cases and decisions Financial and strategic visibility and performance Objectives and Targets Challenges and choices for the Top Team • We can manage only what we can see and understand Organisation and People Business Cases and Decisions Focus and Alignment Financial and strategic visibility and performance Objectives and Targets • Which financial measures will give us comfort in understanding where value is (and is likely to be) created and destroyed in the business? • Measures that include all the costs of doing business • Measures that recognize the particular nature of the property business (asset revaluations etc) • Measures that our managers can use to improve decision-making • How should we understand “strategy” from a value perspective: • Common, value-based frameworks? • Common, value-based language and terminology? • Information and expertise? • Understanding the “where's” and “whys” of value creation and destruction: • Customers? • Competitors? • Asset types? • Geographies? • Other? • Understanding and prioritising the key issues and opportunities we face
Infrastructure People and alignment Focus, agendas, business cases and decisions Financial and strategic visibility and performance Objectives and Targets Financial visibility and performance (“where value is created and destroyed”) • MVA (represented by EP over time) is the best internal proxy for shareholder value Financial Times Any value that managers have created (above and beyond the money which has been invested) (£3m) Britain plc number of shares (2m) x the share price (£5) = the “market capitalisation” (£10m) The money that investors (and managers) have invested (reinvested) in the business since it started (£7m) Market Value Added (MVA) This what the owners of the business want managers to maximise EP (£) Stock market view Shareowner view The best proxy for this is the future stream of cash flow or Economic Profit; including a terminal value; discounted back to today Market Value Added (MVA) time
Infrastructure People and alignment Focus, agendas, business cases and decisions Financial and strategic visibility and performance Objectives and Targets Shareholder value: key internal performance metric • Value-based businesses use three main value-based financial measures (on top of other financial measures needed to manage the business) Uses of Financial Measures Annual value creation (Economic profit) Economic profit over time (Market Value Added) Total shareholder returns (TSR) • Creating strategic insights • Making strategic choices • Targeting, measuring and rewarding realised performance • Reinforcing the Governing Objective • Yes • No • Yes • Yes • Yes • Yes • No • Yes • Yes • No • Yes • (Group-level only) • Yes • (Group-level only) Financial measures should be thought of (like pay) as a way of communicating with managers about what matters…
Infrastructure People and alignment Focus, agendas, business cases and decisions Financial and strategic visibility and performance Objectives and Targets PROFIT & LOSS ITEMS Net Operating Profit After Tax (NOPAT) • NOPAT factors in all expenses, including deductions for taxes and depreciation (which are both genuine costs that have to be managed) in order to provide a complete picture of operating profitability • NOPAT = EBIT x (1 - tax rate) Economic Profit minus BALANCE SHEET ITEMS • Capital charge is the minimal acceptable returns that both debt holders and shareholders expect to earn from the company on their investment A charge for capital Economic Profit includes all the costs of doing business • EP combines information from the P&L and the Balance Sheet It can be used across the business in many ways, for example: • It can be used to understand where value has been created or destroyed in a single period so that managers can take appropriate decisions: • by business • by business unit (eg Value Centre) • by geography • by asset type, size or age • by product category • by product • by customer or customer segment • by supplier • It can be used to show managers where we are experience “good growth” and “bad growth” so that they can take appropriate decisions • It can be used to set single- and multi-period targets for performance (where the period is often a year) • It can be used to reward managers for achieving single-period performance
Infrastructure People and alignment Focus, agendas, business cases and decisions Financial and strategic visibility and performance Objectives and Targets Operating profit per unit. Economic profit per unit Units Units Economic Profit can give very different signals to management • EP is not the same as Operating Profit • Signal to management: • most of the business is profitable • products/segments • sq. ft • we have a growth issue • most growth is good • Impact on management behaviour: • search for growth dominates decisions • Signal to management: • most of the business is unprofitable • products/segments • sq. ft • we have growth issues and profitability issues and we know where they are • Impact on management behaviour: • search for growth dominates some decisions • search for profitability improvement dominates other decisions
Internal Measure External Measure External Measure TSR EP MVA ΔEP ΔMVA TSR Market Value Added (MVA) • Re-cap Market value of equity (market capitalisation) Equity market value added (MVA) Warranted MVA (ie in the grounded judgement of managers) is what managers should be seeking to grow and maximise And they should do this by taking decisions which maximise the NPV of the future stream of Economic Profits Book value of equity Book value of equity, as shown in the accounts, plus some adjustments for things like allowances for bad debts, amortisation of goodwill, and amortisation of R & D Warranted equity value (WEV) Market Capitalisation Equity Capital Invested Market value added
Market Value Added (MVA) • MVA and EP over time Terminal Value (TV) EP The best proxy for MVA is the future stream of EP (including a terminal value) discounted back to today at the cost of capital TV = terminal value (calculated as a perpetuity) ke = the cost of equity capital g = growth rate in perpetuity Time
Infrastructure People and alignment Focus, agendas, business cases and decisions Financial and strategic visibility and performance Objectives and Targets Direct Competition EP Segment B Value creation Profitable Segment B Customer Pressure Market Economics 0 Investment Market Growth Segment A Value destruction Segment A Unprofitable Supplier Pressure Disadvantaged Advantaged Relative Competitive Position Participation strategy – decisions about where to compete Indirect Competition Competitive strategy – decisions about how to compete Threat of Entry Regulatory Pressure Strategic insights (“why value is created and destroyed”) • Value is a consequence o of market economics and our relative competitive position in those markets Strategy.........................linked to.......................Finance Business model(s) Relative Differentiation Position Relative Price Position Relative Economic Cost Position Relative Competences
Infrastructure People and alignment Focus, agendas, business cases and decisions Financial and strategic visibility and performance Objectives and Targets 1980 1990 WalMart EP $30m $528m MVA $664m $28.3bn Gross margin 23% 23% Kmart EP -$43m -$172m MVA -$505m -$1.3bn Gross margin 28% 28% Change in investment (1981 - 1990) Average EP as a % of Capital Illustration* General Electric (Good Growth) General Motors (Bad Growth) Sales Growth Change in Market Value $13.7bn $13.4bn Annual Shareholder Returns* 5% (6%) 125% 126% $6.7bn $47.0bn 1 21% 11% *US market average was 18% * from: “The Value Imperative” Managing the growth/return trade-off • Managers need to differentiate between ”good” and “bad” growth • The Governing Objective is to maximise shareholder value at al;l points in time; not to grow market share; to maximise EPS; to maximise revenue, etc • Maximising top line or bottom line growth may or may not be consistent with the objective of maximising value • Managing to maximise value means that managers need to able to identify and implement “good growth” strategies and to be effective in eliminating “bad growth” strategies at all levels
Infrastructure People and alignment Focus, agendas, business cases and decisions Financial and strategic visibility and performance Objectives and Targets EP Capital*(ROI - WACC) Value = (perpetuity) = (Ke - g) (Ke - g) Managing the growth/return trade-off • The value-maximising answer may not be obvious (and may may not align well with company “legend”) – it depends on the starting point Low-return business High-return business Growth in capital Growth in capital 3% 4% 5% 3% 4% 5% 1% more growth, or 1% more return? 35% 7% £37 bn £1.9 bn 36% 8% ROI ROI 37% 9% ke 7.2% WACC 6.5% Capital £4bn
Infrastructure People and alignment Focus, agendas, business cases and decisions Financial and strategic visibility and performance Objectives and Targets Managing the growth/return trade-off • The value-maximising answer may not be obvious (and may may not align well with company “legend”) – it depends on the starting point Low-return business High-return business Growth in capital Growth in capital 3% 4% 5% 3% 4% 5% 7% 35% £0.5bn £0.6bn £0.9bn £27bn £36bn £52bn £37bn £54bn £2.7bn £1.9bn ROI 8% ROI 36% £28bn £1.4bn £38bn £3.1bn 9% £2.4bn £4.5bn 37% £29bn £55bn For high-return business, trade-off typically favours growth For low-return business, trade-off typically favours return
Infrastructure People and alignment Focus, agendas, business cases and decisions Financial and strategic visibility and performance Objectives and Targets Direct Competition Customer Pressure Market Growth Supplier Pressure Indirect Competition Threat of Entry Regulatory Pressure Strategic Threats Agenda • A Strategic Threat is one that will cause an unwanted reduction in Market Economics and/or a deterioration in our Relative Competitive Position Illustrations of potential Strategic Threats Arrival of a new competitor Value creation Profitable Individual customers taking a very large proportion of output Market Economics Market growth declining or contracting Value destruction Unprofitable Disadvantaged Advantaged Suppliers consolidating Relative Competitive Position Participation strategy – decisions about where to compete New technologies emerging Competitive strategy – decisions about how to compete Business model(s) Relative Differentiation Position Relative Price Position Relative Economic Cost Position Entry barriers dropping Relative Competences Government becoming activist Offer becoming less attractive or differentiated (CBR falling) Lower-cost competitors fighting on price Economic costs rising faster than competitors
Infrastructure People and alignment Focus, agendas, business cases and decisions Financial and strategic visibility and performance Objectives and Targets Infrastructure People and Alignment Focus, Agendas, Business Cases, and Decisions Financial and strategic visibility and performance Objectives and Targets Challenges and choices for the Top Team • Applying our efforts and resources in the right places What are our current priorities at Group level? What are our current priorities at Operating Company level? What are our current priorities at function level? How far down into the business do we want to drive these agendas? Who is leading the charge on each of these opportunities and threats? What is the best way for us to go about producing value-based business cases and applying an activist approach to decision-making? Methodology? Tools? Decision-making process?
Infrastructure People and alignment Focus, agendas, business cases and decisions Financial and strategic visibility and performance Objectives and Targets • Profitable Growth Agenda • Developing and delivering the highest value-at-stake Profitable Growth opportunities: • A limitless appetite for profitable growth • Profitable = returns greater than the cost of capital • Profitable = NPV of future EP or cash flows >0 • Strategic Threats Agenda • Identifying and dealing with the highest value-at-stake strategic threats facing the business: • No appetite for unprofitable growth and value destruction • Threats: falling Market Economics and/or deteriorating Relative Competitive Position Focusing managers • “Management Agendas” are the priorities for action for senior managers – these agendas develop and evolve over time Opportunities and threats Opportunities and threats Opportunities and threats Opportunities and threats Opportunities and threats Opportunities and threats Opportunities and threats Opportunities and threats Opportunities and threats Opportunities and threats Opportunities and threats Strategic and Financial Insights • Criteria for inclusion • High value at stake • Management control • Timing
Infrastructure People and alignment Focus, agendas, business cases and decisions Financial and strategic visibility and performance Objectives and Targets Opportunities for “activist” decision-making Analysis Analysis Creativity Analysis Creativity Planning CVI Business Cases • The Top Team is helped to develop CVI Business Cases to resolve each issue on the two agendas Factbase Insights Creation of alternatives Learning, synthesis, and evaluation Alternative approaches to implementation Performance commitments; resource requirements; PIR The where and why of value creation and destruction Financial analysis Strategic analysis Business insights drawn from the factbase Fundamental issues and opportunities identified and prioritised “Diseases not symptoms” “Maximise” requires choosing from alternatives Alternatives evaluated using forecasts with robust assumptions Key learning points identified Synthesis of the value-maximising alternative Alternative approaches to implementation developed and evaluated Implementation plan or contract created based on performance commitments and resource requirements Strategic, operational, and financial milestones set Post Implementation Review mechanism specified
Infrastructure People and alignment Focus, agendas, business cases and decisions Financial and strategic visibility and performance Objectives and Targets • Correct timing being used? • “Why now”? • Fact-based approach adopted • “What do we need to know”? • Insights generated? • “What’s new”? • “Analysis/judgement/intuition”? • Fundamental issue(s) identified • “Diseases not symptoms” • Alternatives-based solutions created and appropriate? • “Not just the old favourites”? • Value-maximising alternative proposed and selected? • “Objective evaluation”? • Implementation plan clear and feasible? • “The best way to go about this…..who, what, when”? Value-based criteria for effective decision-making • Criteria; and attributes of effective decision0making in a managing for value environment • A continuous process • Decision-making is recognised as a continuous and on-going process • Activist decision-making • Senior managers take an activist role in taking decisions on the highest value-at-stake issues and opportunities at several stages during their resolution • A systematic value-based approach • A “facts /issues /alternatives /evaluation /implementation” approach is used to take important decisions • Focussed and prioritised management • Management decisions are focussed on the highest value-at-stake issues and opportunities facing the business • Systematic decision-making • Decision Dialogues are the events at which senior managers become activist in decision-making • Decisions and priorities aligned up and down the organisation • Management Agendas are used to structure issues and opportunities according to their particular characteristics and to ensure that different levels of management are aligned in their priorities and efforts • High-quality decision-making • Specific criteria are used to communicate the quality standards expected of decisions
Infrastructure People and alignment Focus, agendas, business cases and decisions Financial and strategic visibility and performance Objectives and Targets Infrastructure People and Alignment Focus, Agendas, Business Cases, and Decisions Financial and strategic visibility and performance Objectives and Targets Challenges and choices for the Top Team • The skill and will to manage for value What is the best way for us to go about producing the managerial capabilities needed to deliver superior returns to shareholders? How should we align the priorities of managers at different levels in the business?
“Managing for value is more about the people than about the numbers” – continuous upgrading of people capabilities John Sunderland, Group CEO People in value-based companies • Cadbury Schweppes perspective
Infrastructure People and alignment Focus, agendas, business cases and decisions Financial and strategic visibility and performance Objectives and Targets Management skill and capability to manage for shareholder value • Typical changes that are required From... To... • Ambition • Accountability • Capabilities Last years performance plus whatever small increment I can get away with A cog in the wheel Building/protecting functional expertise We can be the best in the world I am on the hook General Manager Implementation Decisions Leadership Performance Micro-managed Big decisions, check everything has been analysed Commander, policeman Lots of targets in lots of detail Set objectives; let them figure out how to achieve the objectives; monitor rigorously Frequent decisions. Check appropriate analysis has been carried out Mentor, facilitator, standard-setter Set broad goals and high standards
Being able to apply the MFV framework and the related analytical tools and techniques (Knowledge) Using sound judgement in setting stretching goals (Judgement/ambition) Being able to produce insights and then to prioritise issues from the factbase (Interpretation/synthesis) Being able to produce innovative alternative ways of resolving issues (Innovation) Being able to communicate complex value-based information effectively (Communication) Understanding and using high standards of decision-making (Decision-making/Standards) People in value-based companies • Developing value-based General Managers Elements of value-based decision-making Types of capability needed • Specifying and creating the FACTBASE • Developing INSIGHTS • Setting stretching GOALS • Identifying and prioritising the ISSUES • Producing innovative ALTERNATIVES • Objective EVALUATION of alternatives • Disciplined PLANNING of implementation • Ongoing MANAGEMENT of implementation and short-term performance
Being able to apply the MFV framework and the related analytical tools and techniques (Knowledge) Using sound judgement in setting stretching goals (Judgement/ambition) Being able to produce insights and then to prioritise issues from the factbase (Interpretation/synthesis) Being able to produce innovative alternative ways of resolving issues (Innovation) Being able to communicate complex value-based information effectively (Communication) Understanding and using high standards of decision-making (Decision-making/Standards) People in value-based companies • Developing value-based General Managers Desired attributes • Factual, rigorous, analytical • Ambitious, pragmatic • Rounded, experienced, imaginative • Innovative, open • Risk-taking • Persuasive, articulate • Delegating, training • Disciplined, demanding, accountable
Management reward in value-based companies • Objectives • To communicate the Governing Objective to managers (again) • To align management and shareholder interests by giving managers the motivation to choose strategies and take decisions that maximise shareholder wealth • To provide sufficient incentive - as measured by the relativity of fixed and variable rewards - to motivate managers to apply their time and energy; to take considered risks; and to make necessary but occasionally unpalatable decisions • To retain the services of valued managers over time • To keep costs to shareholders of management reward at reasonable levels Incentive compensation schemes (rules, metrics) Management focus and decisions • The way we set targets for incentive compensation schemes • What managers do to achieve the incentive targets Market share metrics Earnings metrics Confused metrics Market share-based decisions Earnings-based decisions Confused decisions Shareholder Value-based behaviour and decisions Shareholder Value metrics (Economic Profit, MVA, TSR)
Management reward in value-based companies • Principles • Pay for increasing EP • EP needs to be measured at levels which the employee can affect • No threshold or caps • but bonuses can be negative if EP falls • A target bonus • based on peer companies compensation • probably larger than conventional target bonuses because there is potential for downside in EP bonuses • A bonus bank • to limit swings in bonus • to ensure that bonuses re;ate to sustainable improvements in shareholder value • to permit negative bonuses • Performance targets set by formula, not by negotiation • typical formula is to pay target bonus for prior years EP • formula often forecasts EP improvement per year for 5 years • but the base to which the expected improvement is added is reset each year based on actual experience Boots The Long Term bonus scheme for executive directors is based on the company’s TSR performance relative to a peer group of ten retail and FMCG companies over a four year cycle. The bonus is paid on a sliding scale if Boots achieves a level of eighth or above in the peer group. Cadbury Schweppes (1999 Annual Report) Directors: Annual incentive based on growth in EP (target is 60% of base, rising to 90% (paid 59% and 64% in 1998 and 1999). LTIP: 3-to-6 year cycle; up to 100% of base vs weighted average TSR of a peer group (not listed) Two awards: 1. TSR - No award for mid-peer group performance; full award for 80th percentile; 2. EPS - award paid if EPS > inflation + 4% Tesco Tesco states that its Long Term bonus is based on a number of measures including comparative TSR performance against peer companies. No other details are disclosed. Kingfisher The Long Term bonus scheme for executive directors and certain other senior managers is based on TSR performance relative to a peer group of fifteen retail companies over a three year period. A bonus is paid on a sliding scale for performance in the top half of the peer group.
“Management Agendas” align management priorities up and down the business • “Management Agendas” drive the strategies of the business and its key components in a coordinated and systematic way Group The BU strategy is driven by the BU management agendas BU Which drive Value Centre 1 Value Centre 2 Value Centre 3 Shared Services Value Centre Agendas Which drive PMUs PMUs PMUs Support Centres PMU Agendas
Infrastructure People and alignment Focus, agendas, business cases and decisions Financial and strategic visibility and performance Objectives and Targets Organisation and People Business Cases and Decisions Focs and Alignment Financial and strategic visibility and performance Objectives and Targets Infrastructure People and Alignment Focus, Agendas, Business Cases, and Decisions Financial and strategic visibility and performance Objectives and Targets Challenges and choices for the Top Team • The organisational and personal skill and will to manage for value • Organisation structure • Clarify who is accountable for managing the value of the business • Roles and responsibilities • Best decision-making process • Personal responsibility for value • Management information • Provision • Use
Organisation structure: building blocks • The key objective of organisation structure is to maximise the clarity of accountability for managing the value of the business Chairman Value centres • the level at which the CEO manages the value of the Group (using Dialogues) • the smallest units that have - or could have - essentially independent strategies, with their “own” cash flows and economic profits • Group manages the portfolio of Value Centres and makes trade-offs between Value Centres Product market units • sub-units of a Value Centre with separate groupings of products or customers or both • units which have significant interdependencies with other PMUs in the Value Centre • units with no significant interdependency with any unit outside the Value Centre • Value Centres make trade-offs between the PMUs which they control Support centres • Cost Centres are often created by the Group to provide economy of scale, or to retain particular competences in-house • units which have no independent strategy - they exist to serve Value Centres and PMUs • units which usually do not sell their services outside the Group • units which have economic cost targets rather than economic profit targets Group CEO Value Centre Value Centre Value Centre PMU PMU Support Centre
Organisation structure • Three “maps” of organisation structure help us to think through the best way to structure the business Objectives of structure Three structural “maps” • Structure should facilitate the use of the best decision processes so we create and implement the best strategies • (right process) • Structure should make it clear where opportunities to create value are to be found in the business • (right boundaries) • Structure should maximise clarity of responsibility and accountability for managing the value of the business • (right accountability) Economic map (Where and why value is created and destroyed) Decision-making map (How and where we make decisions) Administration map (How we choose to organise ourselves - structure, roles, responsibilities, etc)
Organisation structure • Economic map – how much “sharing” takes place? • We begin to identify the economic map by considering how much sharing takes place between current organisational units: • sharing of customers (internal and external) • sharing of assets • sharing of the brand (as a particular type of asset) • Little or no sharing: • may well be a Value Centre • Limited sharing • may well be a PMU • Significant sharing • may well be a Cost Centre Economic map (Where and why value is created and destroyed) Decision-making map (How and where we make decisions) Administration map (How we choose to organise ourselves - structure, roles, responsibilities, etc)
Economic map (Where and why value is created and destroyed) Decision-making map (How and where we make decisions) Administration map (How we choose to organise ourselves - structure, roles, responsibilities, etc) Organisation structure • Decision-making map – where is the best place to take decisions? Strategy decisions Participation (where to compete) Competitive (how to compete) Resource allocation decisions People and money Performance management decisions Goal setting Agreeing targets and measures Monitoring and managing delivery of performance
Other external audiences Stock market Economic map (Where and why value is created and destroyed) Chairman Decision-making map (How and where we make decisions) Group CEO Value Centre Value Centre Value Centre Administration map (How we choose to organise ourselves - structure, roles, responsibilities, etc) PMU PMU Support Centre Organisation structure • Administration map – who is “on the hook” for delivery of performance? • Each Value Centre, PMU, or Cost Centre has only one Manager assigned and accountable • But a Manager can be responsible for more than one Value Centre, PMU, or Cost Centre • Line role/responsibility • Company leader role/responsibility
Infrastructure People and alignment Focus, agendas, business cases and decisions Financial and strategic visibility and performance Objectives and Targets Organisation and People Business Cases and Decision Focus and Alignment Financial and strategic visibility and performance Objectives and Targets Infrastructure • Some key principles; and implications for managers Structure Organise around businesses, not functions Clear roles and responsibilities Profit centres at lower levels Structure lets us use the best process No wiggle room on value creation and destruction Decision Processes Dialogues with businesses, not functions Performance measured often Clear understanding about who decides what and how Group sets process and standards Zero tolerance for value creation and destruction Information Info. tailored to BU needs Performance measured often More info. At lower levels Info supports the best process Info a “corporate resource” :EP widely available People Focus on General Managers Performance accountable managers Expertise at lower levels Selected and developed based on strategy Short-term and long-term focus • Focus on businesses, not functions • Maximum clarity of accountability for value • Push decisions close to the customer • Process drives strategy drives structure • Focus on delivering EP
Stock market Other external audiences Chairman Group CEO Value Centre Value Centre Value Centre PMU PMU Support Centre The CEO of the Group • Three key responsibilities 1. Creating the best conditions for value creation • Governing objective and performance goals • Policies and standards • Cultural norms and values • External and internal communication of Group strategy, values, and performance 2. Creating the best organisation for value creation • Organisation structure • Roles and responsibilities for managing value • Decision-making processes and standards • Management information • Motivated and capable people 3. Ensuring that the best strategies are in place at all levels to maximise value creation (using the Management Agendas and Decision Dialogues) • Portfolio of Value Centres and Support Centres • Value Centre participation strategies • Value Centre competitive strategies • Support Centre service and cost strategies