Download
1 / 137
1.37k likes | 1.39k Views
Analysis of bicycle helmet, seat belt use, weapon carrying, and physical fight involvement among middle school students in Delaware from 2007-2015. Trends by sex, grade, and race/ethnicity presented. Results based on YRBS data.

E N D
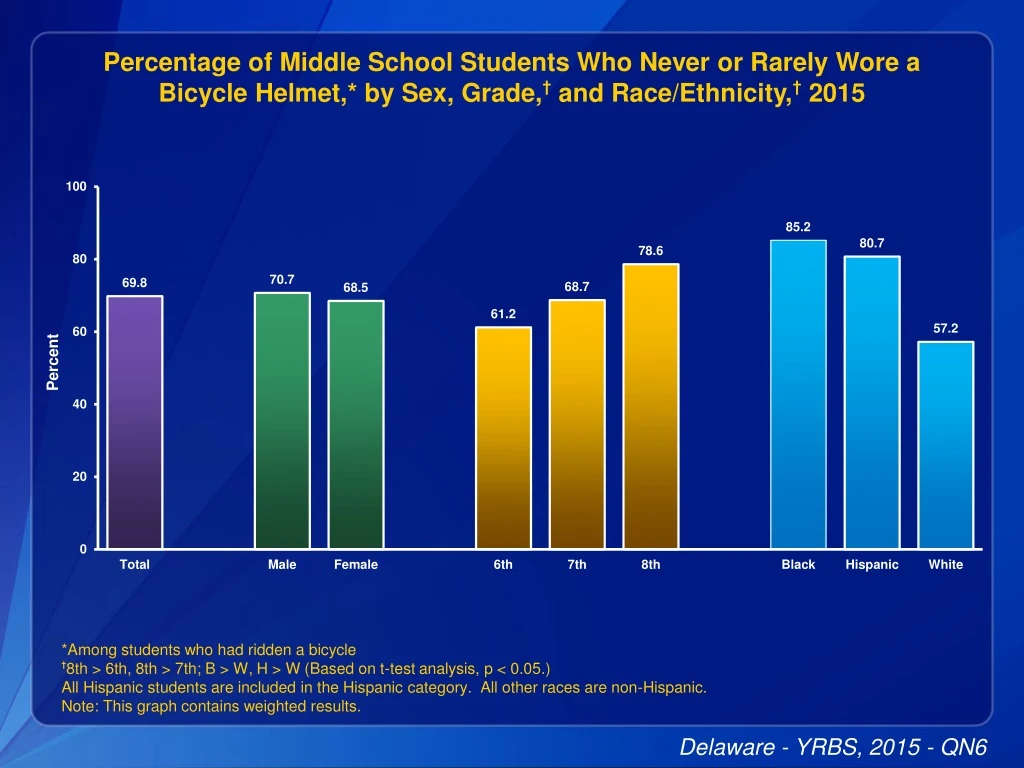
Percentage of Middle School Students Who Never or Rarely Wore a Bicycle Helmet,* by Sex, Grade,† and Race/Ethnicity,† 2015 *Among students who had ridden a bicycle †8th > 6th, 8th > 7th; B > W, H > W (Based on t-test analysis, p < 0.05.) All Hispanic students are included in the Hispanic category. All other races are non-Hispanic. Note: This graph contains weighted results. Delaware - YRBS, 2015 - QN6
Percentage of Middle School Students Who Never or Rarely Wore a Bicycle Helmet,* 2007-2015† *Among students who had ridden a bicycle †Decreased 2007-2015 [Based on linear trend analyses using logistic regression models controlling for sex, race/ethnicity, and grade (p < 0.05).] Note: This graph contains weighted results. Delaware - YRBS, 2007-2015 - QN6
Percentage of Middle School Students Who Never or Rarely Wore a Helmet When Rollerblading or Skateboarding,* by Sex, Grade,† and Race/Ethnicity,† 2015 *Among students who used rollerblades or rode a skateboard †7th > 6th, 8th > 6th; B > W, H > W (Based on t-test analysis, p < 0.05.) All Hispanic students are included in the Hispanic category. All other races are non-Hispanic. Note: This graph contains weighted results. Delaware - YRBS, 2015 - QN7
Percentage of Middle School Students Who Never or Rarely Wore a Helmet When Rollerblading or Skateboarding,* 2009-2015† *Among students who used rollerblades or rode a skateboard †Decreased 2009-2015 [Based on linear trend analyses using logistic regression models controlling for sex, race/ethnicity, and grade (p < 0.05).] Note: This graph contains weighted results. Delaware - YRBS, 2009-2015 - QN7
Percentage of Middle School Students Who Never or Rarely Wore a Seat Belt,* by Sex, Grade,† and Race/Ethnicity,† 2015 *When riding in a car †8th > 6th; B > W, H > W (Based on t-test analysis, p < 0.05.) All Hispanic students are included in the Hispanic category. All other races are non-Hispanic. Note: This graph contains weighted results. Delaware - YRBS, 2015 - QN8
Percentage of Middle School Students Who Never or Rarely Wore a Seat Belt,* 2007-2015† *When riding in a car †Decreased 2007-2015 [Based on linear trend analyses using logistic regression models controlling for sex, race/ethnicity, and grade (p < 0.05).] Note: This graph contains weighted results. Delaware - YRBS, 2007-2015 - QN8
Percentage of Middle School Students Who Rode with a Driver Who Had Been Drinking Alcohol,* by Sex,† Grade,† and Race/Ethnicity, 2015 *In a car †F > M; 8th > 6th, 8th > 7th (Based on t-test analysis, p < 0.05.) All Hispanic students are included in the Hispanic category. All other races are non-Hispanic. Note: This graph contains weighted results. Delaware - YRBS, 2015 - QN9
Percentage of Middle School Students Who Rode with a Driver Who Had Been Drinking Alcohol,* 2007-2015† *In a car †Decreased 2007-2015 [Based on linear trend analyses using logistic regression models controlling for sex, race/ethnicity, and grade (p < 0.05).] Note: This graph contains weighted results. Delaware - YRBS, 2007-2015 - QN9
Percentage of Middle School Students Who Carried a Weapon,* by Sex,† Grade,† and Race/Ethnicity,† 2015 *Such as a gun, knife, or club †M > F; 8th > 6th, 8th > 7th; W > B, W > H (Based on t-test analysis, p < 0.05.) All Hispanic students are included in the Hispanic category. All other races are non-Hispanic. Note: This graph contains weighted results. Delaware - YRBS, 2015 - QN10
Percentage of Middle School Students Who Carried a Weapon,* 2009-2015† *Such as a gun, knife, or club †No change 2009-2015 [Based on linear trend analyses using logistic regression models controlling for sex, race/ethnicity, and grade (p < 0.05).] Note: This graph contains weighted results. Delaware - YRBS, 2009-2015 - QN10
Percentage of Middle School Students Who Were in a Physical Fight, by Sex,* Grade, and Race/Ethnicity,* 2015 *M > F; B > H, B > W, H > W (Based on t-test analysis, p < 0.05.) All Hispanic students are included in the Hispanic category. All other races are non-Hispanic. Note: This graph contains weighted results. Delaware - YRBS, 2015 - QN11
Percentage of Middle School Students Who Were in a Physical Fight, 2007-2015* *Decreased 2007-2015 [Based on linear trend analyses using logistic regression models controlling for sex, race/ethnicity, and grade (p < 0.05).] Note: This graph contains weighted results. Delaware - YRBS, 2007-2015 - QN11
Percentage of Middle School Students Who Were Injured in a Physical Fight,* by Sex, Grade, and Race/Ethnicity, 2015 *Injuries had to be treated by a doctor or nurse All Hispanic students are included in the Hispanic category. All other races are non-Hispanic. Note: This graph contains weighted results. Delaware - YRBS, 2015 - QN12
Percentage of Middle School Students Who Were Injured in a Physical Fight,* 2011-2015† *Injuries had to be treated by a doctor or nurse †Decreased 2011-2015 [Based on linear trend analyses using logistic regression models controlling for sex, race/ethnicity, and grade (p < 0.05).] Note: This graph contains weighted results. Delaware - YRBS, 2011-2015 - QN12
Percentage of Middle School Students Who Were Bullied on School Property, by Sex,* Grade, and Race/Ethnicity,* 2015 *F > M; W > B, W > H (Based on t-test analysis, p < 0.05.) All Hispanic students are included in the Hispanic category. All other races are non-Hispanic. Note: This graph contains weighted results. Delaware - YRBS, 2015 - QN13
Percentage of Middle School Students Who Were Bullied on School Property, 2013-2015* *No change 2013-2015 [Based on linear trend analyses using logistic regression models controlling for sex, race/ethnicity, and grade (p < 0.05).] Note: This graph contains weighted results. Delaware - YRBS, 2013-2015 - QN13
Percentage of Middle School Students Who Were Electronically Bullied,* by Sex,† Grade,† and Race/Ethnicity,† 2015 *Including through e-mail, chat rooms, instant messaging, web sites, or texting †F > M; 8th > 6th, 8th > 7th; W > B, W > H (Based on t-test analysis, p < 0.05.) All Hispanic students are included in the Hispanic category. All other races are non-Hispanic. Note: This graph contains weighted results. Delaware - YRBS, 2015 - QN14
Percentage of Middle School Students Who Were Electronically Bullied,* 2013-2015† *Including through e-mail, chat rooms, instant messaging, web sites, or texting †No change 2013-2015 [Based on linear trend analyses using logistic regression models controlling for sex, race/ethnicity, and grade (p < 0.05).] Note: This graph contains weighted results. Delaware - YRBS, 2013-2015 - QN14
Percentage of Middle School Students Who Seriously Thought About Killing Themselves, by Sex,* Grade,* and Race/Ethnicity, 2015 *F > M; 8th > 6th (Based on t-test analysis, p < 0.05.) All Hispanic students are included in the Hispanic category. All other races are non-Hispanic. Note: This graph contains weighted results. Delaware - YRBS, 2015 - QN15
Percentage of Middle School Students Who Seriously Thought About Killing Themselves, 2007-2015* *Decreased 2007-2015 [Based on linear trend analyses using logistic regression models controlling for sex, race/ethnicity, and grade (p < 0.05).] Note: This graph contains weighted results. Delaware - YRBS, 2007-2015 - QN15
Percentage of Middle School Students Who Made a Plan About How They Would Kill Themselves, by Sex,* Grade,* and Race/Ethnicity, 2015 *F > M; 7th > 6th, 8th > 6th (Based on t-test analysis, p < 0.05.) All Hispanic students are included in the Hispanic category. All other races are non-Hispanic. Note: This graph contains weighted results. Delaware - YRBS, 2015 - QN16
Percentage of Middle School Students Who Made a Plan About How They Would Kill Themselves, 2007-2015* *Increased 2007-2015 [Based on linear trend analyses using logistic regression models controlling for sex, race/ethnicity, and grade (p < 0.05).] Note: This graph contains weighted results. Delaware - YRBS, 2007-2015 - QN16
Percentage of Middle School Students Who Tried to Kill Themselves, by Sex,* Grade, and Race/Ethnicity,* 2015 *F > M; H > W (Based on t-test analysis, p < 0.05.) All Hispanic students are included in the Hispanic category. All other races are non-Hispanic. Note: This graph contains weighted results. Delaware - YRBS, 2015 - QN17
Percentage of Middle School Students Who Tried to Kill Themselves, 2013-2015* *No change 2013-2015 [Based on linear trend analyses using logistic regression models controlling for sex, race/ethnicity, and grade (p < 0.05).] Note: This graph contains weighted results. Delaware - YRBS, 2013-2015 - QN17
Percentage of Middle School Students Who Ever Tried Cigarette Smoking,* by Sex, Grade,† and Race/Ethnicity,† 2015 *Even one or two puffs †8th > 6th, 8th > 7th; H > W (Based on t-test analysis, p < 0.05.) All Hispanic students are included in the Hispanic category. All other races are non-Hispanic. Note: This graph contains weighted results. Delaware - YRBS, 2015 - QN18
Percentage of Middle School Students Who Ever Tried Cigarette Smoking,* 2007-2015† *Even one or two puffs †Decreased 2007-2015 [Based on linear trend analyses using logistic regression models controlling for sex, race/ethnicity, and grade (p < 0.05).] Note: This graph contains weighted results. Delaware - YRBS, 2007-2015 - QN18
Percentage of Middle School Students Who Smoked a Whole Cigarette Before Age 11 Years,* by Sex, Grade, and Race/Ethnicity,† 2015 *For the first time †H > W (Based on t-test analysis, p < 0.05.) All Hispanic students are included in the Hispanic category. All other races are non-Hispanic. Note: This graph contains weighted results. Delaware - YRBS, 2015 - QN19
Percentage of Middle School Students Who Smoked a Whole Cigarette Before Age 11 Years,* 2007-2015† *For the first time †Decreased 2007-2015 [Based on linear trend analyses using logistic regression models controlling for sex, race/ethnicity, and grade (p < 0.05).] Note: This graph contains weighted results. Delaware - YRBS, 2007-2015 - QN19
Percentage of Middle School Students Who Currently Smoked Cigarettes,* by Sex, Grade,† and Race/Ethnicity,† 2015 *On at least 1 day during the 30 days before the survey †7th > 6th, 8th > 6th; H > B, W > B (Based on t-test analysis, p < 0.05.) All Hispanic students are included in the Hispanic category. All other races are non-Hispanic. Note: This graph contains weighted results. Delaware - YRBS, 2015 - QN20
Percentage of Middle School Students Who Currently Smoked Cigarettes,* 2007-2015† *On at least 1 day during the 30 days before the survey †Decreased 2007-2015 [Based on linear trend analyses using logistic regression models controlling for sex, race/ethnicity, and grade (p < 0.05).] Note: This graph contains weighted results. Delaware - YRBS, 2007-2015 - QN20
Percentage of Middle School Students Who Currently Frequently Smoked Cigarettes,* by Sex,† Grade,† and Race/Ethnicity, 2015 *On 20 or more days during the 30 days before the survey †M > F; 8th > 6th (Based on t-test analysis, p < 0.05.) All Hispanic students are included in the Hispanic category. All other races are non-Hispanic. Note: This graph contains weighted results. Delaware - YRBS, 2015 - QNFRCIG
Percentage of Middle School Students Who Currently Frequently Smoked Cigarettes,* 2007-2015† *On 20 or more days during the 30 days before the survey †Decreased 2007-2015 [Based on linear trend analyses using logistic regression models controlling for sex, race/ethnicity, and grade (p < 0.05).] Note: This graph contains weighted results. Delaware - YRBS, 2007-2015 - QNFRCIG
Percentage of Middle School Students Who Currently Smoked Cigarettes Daily,* by Sex,† Grade,† and Race/Ethnicity, 2015 *On all 30 days during the 30 days before the survey †M > F; 8th > 6th (Based on t-test analysis, p < 0.05.) All Hispanic students are included in the Hispanic category. All other races are non-Hispanic. Note: This graph contains weighted results. Delaware - YRBS, 2015 - QNDAYCIG
Percentage of Middle School Students Who Currently Smoked Cigarettes Daily,* 2007-2015† *On all 30 days during the 30 days before the survey †Decreased 2007-2015 [Based on linear trend analyses using logistic regression models controlling for sex, race/ethnicity, and grade (p < 0.05).] Note: This graph contains weighted results. Delaware - YRBS, 2007-2015 - QNDAYCIG
Percentage of Middle School Students Who Smoked More Than 10 Cigarettes Per Day,* by Sex, Grade, and Race/Ethnicity, 2015 *During the 30 days before the survey, among students who currently smoked cigarettes on the days they smoked All Hispanic students are included in the Hispanic category. All other races are non-Hispanic. Missing bar indicates fewer than 100 students in this subgroup. Note: This graph contains weighted results. Delaware - YRBS, 2015 - QN21
Percentage of Middle School Students Who Usually Obtained Their Own Cigarettes by Buying Them in a Store or Gas Station,* by Sex, Grade, and Race/Ethnicity, 2015 *During the 30 days before the survey, among the students who currently smoked cigarettes All Hispanic students are included in the Hispanic category. All other races are non-Hispanic. Missing bar indicates fewer than 100 students in this subgroup. Note: This graph contains weighted results. Delaware - YRBS, 2015 - QN22
Percentage of Middle School Students Who Currently Used Smokeless Tobacco,* by Sex,† Grade, and Race/Ethnicity, 2015 *Chewing tobacco, snuff, or dip on at least 1 day during the 30 days before the survey †M > F (Based on t-test analysis, p < 0.05.) All Hispanic students are included in the Hispanic category. All other races are non-Hispanic. Note: This graph contains weighted results. Delaware - YRBS, 2015 - QN23
Percentage of Middle School Students Who Currently Used Smokeless Tobacco,* 2007-2015† *Chewing tobacco, snuff, or dip on at least 1 day during the 30 days before the survey †Decreased 2007-2015 [Based on linear trend analyses using logistic regression models controlling for sex, race/ethnicity, and grade (p < 0.05).] Note: This graph contains weighted results. Delaware - YRBS, 2007-2015 - QN23
Percentage of Middle School Students Who Currently Smoked Cigars,* by Sex, Grade,† and Race/Ethnicity,† 2015 *Cigars, cigarillos, or little cigars on at least 1 day during the 30 days before the survey †8th > 6th; H > W (Based on t-test analysis, p < 0.05.) All Hispanic students are included in the Hispanic category. All other races are non-Hispanic. Note: This graph contains weighted results. Delaware - YRBS, 2015 - QN24
Percentage of Middle School Students Who Currently Smoked Cigars,* 2007-2015† *Cigars, cigarillos, or little cigars on at least 1 day during the 30 days before the survey †Decreased 2007-2015 [Based on linear trend analyses using logistic regression models controlling for sex, race/ethnicity, and grade (p < 0.05).] Note: This graph contains weighted results. Delaware - YRBS, 2007-2015 - QN24
Percentage of Middle School Students Who Ever Used Electronic Vapor Products,* by Sex, Grade,† and Race/Ethnicity,† 2015 *E-cigarettes, e-cigars, e-pipes, vape pipes, vaping pens, e-hookahs, and hookah pens such as blu, NJOY, or Starbuzz †7th > 6th, 8th > 6th, 8th > 7th; B > W, H > W (Based on t-test analysis, p < 0.05.) All Hispanic students are included in the Hispanic category. All other races are non-Hispanic. Note: This graph contains weighted results. Delaware - YRBS, 2015 - QN25
Percentage of Middle School Students Who Currently Used Electronic Vapor Products,* by Sex, Grade,† and Race/Ethnicity,† 2015 *E-cigarettes, e-cigars, e-pipes, vape pipes, vaping pens, e-hookahs, and hookah pens such as blu, NJOY, or Starbuzz on at least 1 day during the 30 days before the survey †8th > 6th; B > W, H > W (Based on t-test analysis, p < 0.05.) All Hispanic students are included in the Hispanic category. All other races are non-Hispanic. Note: This graph contains weighted results. Delaware - YRBS, 2015 - QN26
Percentage of Middle School Students Who Currently Used Tobacco,* by Sex, Grade,† and Race/Ethnicity,† 2015 *Current cigarette, smokeless tobacco, cigar, or electronic vapor product use on at least 1 day during the 30 days before the survey †8th > 6th, 8th > 7th; B > W, H > W (Based on t-test analysis, p < 0.05.) All Hispanic students are included in the Hispanic category. All other races are non-Hispanic. Note: This graph contains weighted results. Delaware - YRBS, 2015 - QNTOB4
Percentage of Middle School Students Who Currently Used Cigarettes, Cigars, or Smokeless Tobacco,* by Sex, Grade,† and Race/Ethnicity, 2015 *On at least 1 day during the 30 days before the survey †8th > 6th (Based on t-test analysis, p < 0.05.) All Hispanic students are included in the Hispanic category. All other races are non-Hispanic. Note: This graph contains weighted results. Delaware - YRBS, 2015 - QNTOB3
Percentage of Middle School Students Who Currently Used Cigarettes, Cigars, or Smokeless Tobacco,* 2007-2015† *On at least 1 day during the 30 days before the survey †Decreased 2007-2015 [Based on linear trend analyses using logistic regression models controlling for sex, race/ethnicity, and grade (p < 0.05).] Note: This graph contains weighted results. Delaware - YRBS, 2007-2015 - QNTOB3
Percentage of Middle School Students Who Currently Smoked Cigarettes or Cigars,* by Sex, Grade,† and Race/Ethnicity,† 2015 *On at least 1 day during the 30 days before the survey †8th > 6th, 8th > 7th; H > W (Based on t-test analysis, p < 0.05.) All Hispanic students are included in the Hispanic category. All other races are non-Hispanic. Note: This graph contains weighted results. Delaware - YRBS, 2015 - QNTOB2
Percentage of Middle School Students Who Currently Smoked Cigarettes or Cigars,* 2007-2015† *On at least 1 day during the 30 days before the survey †Decreased 2007-2015 [Based on linear trend analyses using logistic regression models controlling for sex, race/ethnicity, and grade (p < 0.05).] Note: This graph contains weighted results. Delaware - YRBS, 2007-2015 - QNTOB2
Percentage of Middle School Students Who Did Not Currently Use Tobacco,* by Sex, Grade,† and Race/Ethnicity,† 2015 *Current cigarette, smokeless tobacco, cigar, or electronic vapor product use on at least 1 day during the 30 days before the survey †6th > 7th, 6th > 8th, 7th > 8th; W > B, W > H (Based on t-test analysis, p < 0.05.) All Hispanic students are included in the Hispanic category. All other races are non-Hispanic. Note: This graph contains weighted results. Delaware - YRBS, 2015 - QNNOTOB4
Percentage of Middle School Students Who Did Not Currently Use Cigarettes, Cigars, or Smokeless Tobacco,* by Sex, Grade,† and Race/Ethnicity, 2015 *On at least 1 day during the 30 days before the survey †6th > 7th, 6th > 8th (Based on t-test analysis, p < 0.05.) All Hispanic students are included in the Hispanic category. All other races are non-Hispanic. Note: This graph contains weighted results. Delaware - YRBS, 2015 - QNNOTOB3
Percentage of Middle School Students Who Did Not Currently Use Cigarettes, Cigars, or Smokeless Tobacco,* 2007-2015† *On at least 1 day during the 30 days before the survey †Increased 2007-2015 [Based on linear trend analyses using logistic regression models controlling for sex, race/ethnicity, and grade (p < 0.05).] Note: This graph contains weighted results. Delaware - YRBS, 2007-2015 - QNNOTOB3