Download
1 / 34
461 likes | 889 Views
numerical optimization and experimental validation of hydrodynamic cavitation devices. A. B. Pandit Institute of Chemical Technology University of Mumbai INDIA. introcution. Cavitation in many cases such as propellers and pumps is an undesirable occurrence.

E N D
numerical optimization and experimental validation of hydrodynamic cavitation devices A. B. Pandit Institute of Chemical Technology University of Mumbai INDIA
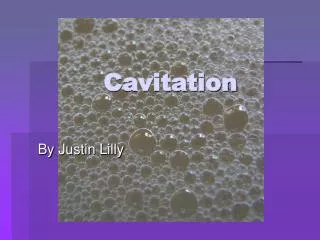
introcution • Cavitation in many cases such as propellers and pumps is an undesirable occurrence. • When cavitation takes place, local hot spots and ( upto10000 K) and shock waves are generated (pressures upto1000 atm). • Earlier efforts for dealing with cavitation have been directed towards avoiding it. • Such high energy released during cavitation can be harnessed for the positive effects of cavitation. • Applications: • Wastewater treatment • Water/ wastewater disinfection • Size reduction
Introduction • Objective of the work • Comparison of numerical simulations of elliptical, rectangular slit and standard circular venturi on the basis of cavitational efficacy. • Experimental validation by comparing results of rectangular slit venturi with standard circular venturi and orifice plate. • Advantages of Using Non-Circular Venturi • Higher p/a Ratio; i.e. More length available to produce shear . For same cross sectional area • More number of cavitational events • Higher Cavitational efficacy • Experimental outcome • Non circular venturis gives higher cavitatonal yield compared to standard circular venturi and orifice plate.
Outline of Present work • CFD Simulations: • Simulations of Standard Circular Venturi, Slit Venturi and Elliptical Venturi • Comparison of the three geometries based on the CFD simulations • Experimental Studies • Experimental studies on Slit venturi geometry reported by Bashir et al. (2011) • Comparison of Standard Circular Venturi, Slit venturi and Circular Orifice based on the experimental results
CFD Simulations • Geometries Considered: • Standard Circular Venturi • Rectangular Slit Venturi • Elliptical Venturi • Softwares Used: • Gambit 2.2.30 • Ansys Fluent 6.30
Modeling Strategy • Equations used by Realizable k-ε Model: • Equation for Turbulent Kinetic Energy (k) • Equation for Dissipation Rate (ε)
Modeling Strategy • Cavitation Model: • Cavitation Number • “Full cavitation model” by Singhal et al. (2001) • Rayleigh-Plesset equation • Second order term is eliminated and is solved on the assumptions of isothermal expansion of the isothermal cavity collapse • Both bubble formation and subsequent collapse are taken into account in the model
Modeling Strategy • Equations Used in Cavitational Model: • Vapor Transport Equation • Equation for local static pressure • Equation for turbulence induced pressure fluctuations
Modeling Strategy • Effect of non-condensable gases • Equation for Phase change rates
CFD Simulations of Standard Circular Venturi • Geometry: • 2D Geometry • QUAD Meshing, • Mesh Number-22500 • Turbulence Models-SST k-ω model and Realizable k-ε model
CFD Simulations of Standard Circular Venturi • Inlet Pressure – 5 bar, Outlet Pressure – 1 bar Pressure Contours Velocity Contours
CFD Simulations of Standard Circular Venturi • Pressure and Velocity Profiles
CFD Simulations of Standard Circular Venturi • Effect of Inlet Pressure
CFD Simulations of Standard Circular Venturi • Effect of Inlet Pressure • As inlet pressure increases cavitation number decreases which indicates increase in intensity of cavitation. • Cavitation activity at the pressures above 5 bar is almost constant. So all further simulations were carried out at the pressure of 5 bar.
CFD Simulations of Rectangular Slit Venturi • Geometry • 3D Geometry • HEX Meshing, • Mesh Number - 200,000 • Turbulence Models- Realizable k-ε model
CFD Simulations of Rectangular Slit Venturi • Meshing • Slit Venturi Designs
CFD Simulations of Rectangular Slit Venturi (L/W = 1:0.2) • Pressure Contours
CFD Simulations of Rectangular Slit Venturi (L/W = 1:0.2) • Velocity Contours
CFD Simulations of Rectangular Slit Venturi (L/W = 1:0.2) • Pressure Zones
CFD Simulations of Rectangular Slit Venturi (L/W = 1:0.5) • Pressure Zones
CFD Simulations of Rectangular Slit Venturi (L/W = 1:1) • Pressure Zones
CFD Simulations of Elliptical Venturi • Geometry • 3D Geometry • HEX/WEDGE Meshing, • Mesh Number - 550,000 • Turbulence Models- Realizable k-ε model
CFD Simulations of Elliptical Venturi • Meshing • Elliptical Venturi Design
CFD Simulations of Elliptical Venturi (D1/D2=1:0.2) • Pressure Zones
CFD Simulations of Elliptical Venturi (D1/D2=1:0.5) • Pressure Zones
CFD Simulations of Elliptical Venturi (D1/D2=1:0.8) • Pressure Zones
Comparison of Circular and Non-Circular Venturi • As perimeter of throat increases more length is available for shear production, resulting in more number of cavitational events • Slit venturi with p/a ratio of 3.03 and elliptical venturi with p/a ratio of 2.99 show maximum number of cavitational events as shown in table • More number of cavities means they would behave as a cluster rather than a single cavity which increases intensity of collapse.
Experimental Studies • Experiments were performed for orange-G dye degradation • Circular venturi, circular orifice and slit venturi were used for the experiments. • The experimental setup used is as shown below:
Circular Orifice Geometry • Circular Venturi Geometry 17 mm 2 mm 1 mm
Comparison of the devices on the basis of % decolorisation of dye
Comparison of the devices on the basis of mg of TOC reduced per unit of energy supplied
Conclusions • Cavitational intensity depends on perimeter to cross sectional area ratio, and it was found that non-circular venturi with a higher perimeter to cross sectional area ratio show more cavitation. • In non-circular venturis more number of cavities are formed which collapse over a shorter length compared to circular venturi. However the experimental results suggest that the collapse is more violent and results in higher cavitational intensity. • Applications of non-circular venturi can be found in intensification of processes involving physical as well as chemical transformations. Examples of such processes are cell disruption, water disinfection, oxidation and degradation of pollutants etc.