Download
1 / 13
130 likes | 156 Views
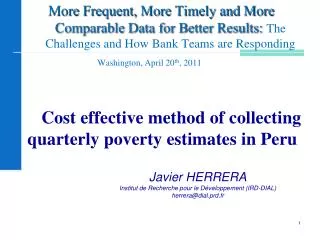
Explore the impact of rural poverty in Peru through statistical data and analysis. Learn about the National Households Survey and the disparities between urban and rural areas in poverty, hunger, and unsatisfied basic needs.

E N D
Instituto Nacional de Estadística e Informática Rural poverty in Peru Ursula Sánchez Instituto Nacional de Estadística e Informática
Structure • Introduction • The National Households Survey • Closing the gap:Rural poverty and Hunger • Poverty expressions in the rural areas • Final remarks
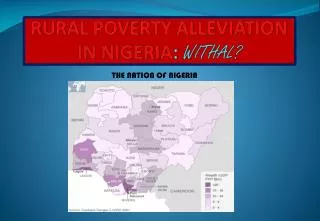
Rural poverty numbers Introduction • Represents 63% of the world poverty • 30% of the Peruvian population is rural, of those 74% are poor • Extreme cases: Huancavelica were 9 of every 10 households live in poverty conditions
1995 1997 2003 First survey MECOVI Improved version Change in periodicity Monthly operation 20,000 16,000 12,000 8,000 4,000 0 1997 1998 1999 2000 2001 2002 2003 Urban Rural The National Households Survey • Interview average time : 3.5 hours Education, health, employment, income and expenditure, access to social programs, etc. Subjects covered • Sample – 20,000 households
Poverty incidence Poverty Severe Poverty 9 40 74 43 2003 2003 Total 21 52 0 10 20 30 40 50 0 10 20 30 40 50 60 70 80 42 77 % 10 % Rural 50 2002 2002 54 24 Urban 42 10 51 78 2001 2001 24 55 Closing the gap… • Rural area: most vulnerable in Peru • Poverty indicators: important differences between urban and rural areas
50 45 40 % 35 30 25 20 2001 2002 2003 Rural caloric deficit Urban caloric deficit Closing the gap… Hunger • Hunger levels are still high • Important reduction over the last year for the rural areas
6% 26% 17% 32% 77% Urban Rural 42% Severe Poor Poor Not poor Closing the gap… Unsatisfied basic needs • Rural areas unsatisfied basic needs persists: little reduction in poverty measured with this indicator
50 40 30 20 …with inadequate …with ….without drainage ..with kids who 10 conditions overcrowded don´t attend conditions school 0 Households.... Urban Rural Closing the gap… Unsatisfied basic needs • Important deficiencies persists in the rural areas…
Closing the gap… Poverty by altitude • The Peruvian territory is divided by three natural regions, that form eight steps from the bases to the summits
Altitude Population Poverty incidence 2001 2002 Chala 0 - 500 mts 23% 47.3% 48.0% Yunga 501 - 2300 mts 13% 59.6% 59.2% Quechua 2301 - 3500 mts 15% 72.4% 67.9% Suni, Puna, Janca 3501 - >4800 mts 12% 79.8% 78.0% Rupa Rupa 400 - 1000 mts 4% 71.8% 69.5% Omagua 80 - 400 mts 7% 68.5% 65.8% Metropolitan Lima 26% 31.9% 34.7% Closing the gap… Poverty by altitude • Estimates demonstrated a positive correlation between altitude and poverty levels
Most vulnerables: Children Poverty expressions…. • Some indicators give us an idea of the precarious conditions of the rural areas: • 12% of the children under 5 had inadequate weight • 60 of every 1000 children born alive die before reaching 1 year • Only 20% of the children finish primary school on time
- 4.8 78.4% - 5.1 64.0% Rural 73.6% Provinces 58.9% Economic growth: 8.8% - 1.7 42.0% Urban +2.8 40.3% Poverty rates Lima 34.7% 31.9% Last few years: Poverty focalization 2001 2003 Final remarks • High poverty rates persists in rural areas • Over the last decades: socioeconomic policies increased the differences
Instituto Nacional de Estadística e Informática Rural poverty in Peru Ursula Sánchez Instituto Nacional de Estadística e Informática