Download
1 / 23
230 likes | 432 Views
Winter Season Forecasting Using the Winter Disruptiveness Index. Methodology and results of the 2002/2003 Winter season forecast. Dan Swank Meteo 497: Long Range Forecasting. The Winter Disruptiveness Index (WDI). A quantitative measure of winter season severity.

E N D
Winter Season Forecasting Using the Winter Disruptiveness Index Methodology and results of the 2002/2003 Winter season forecast. Dan Swank Meteo 497: Long Range Forecasting
The Winter Disruptiveness Index (WDI) • A quantitative measure of winter season severity. • Defined over the time period November through March • Designed to be applicable everywhere • A numeric scale: Higher values denote cold and snowy winter seasons • Negative values for mild winters • Values are the sum of seven components
The 7 WDI Components:What can be forecasted with WDI? • Average NDJFM Temperature • Total NDJFM Snowfall • NDJFM # days with >= 1” snowcover • Abnormally cold days • Abnormal daily snowfall • Abnormal daily rainfall • Ice storms
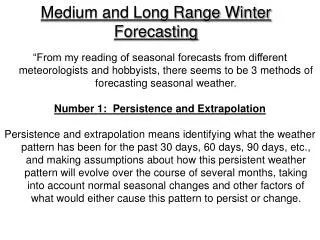
How can we forecast the next winters WDI? • Use Analog forecasting. Currently two experimental methods. • Compare global 500 mb height anomalies during summer/autumn months for years when the WDI is between a certain range (i.e. > 12) • Correlate average monthly values of oceanic-atmospheric indices, before November, to that seasons WDI value.
Averaged 500 Mb Height anomalies:Analog forecasting method • This method can gives a general idea of the likely outcome of the coming winter, but does not give an exact value for the WDI • Take the average height anomaly over 3 months, such as August, September, and October. Average them over all years where the WDI is within a given range • Maps shown on the next slide are composites of 4 years where the WDI was between a set range. • These maps would be different if WDI value at another location are used • Interestingly, teleconnection nodes tend to show u in the averaged 500 mb analyses
WDI >12 6 to 12 0 - 6 <-4
500 mb analog method • Often anomaly comparisons may be inconclusive. Unless patterns similar to the extreme cases are present, go near normal. • The 2002/03 pattern best matched the harsh (6 to 12) regime. Although vaguely. • This method can also be applied with any of the 7 WDI components, to forecast likely temperature and precip trends. • Other month ranges (besides ASO) can be used, however months closer to November will probably be more reliable.
Oceanic Atmospheric Indices: Analog forecasting method • Correlate the WDI to averaged monthly values of Ocean/Atmospheric indices such as the NAO, SOI, and PNA using various lag/span computations. • For example: Each years average April through August NAO correlated with the value of WDI for the following winter, starting in November. • Much more complicated then the 500 mb method, but gives an exact forecast value for the WDI. • Used to make the 2002/03 forecast
Oceanic Atmospheric Indices method • Must use a computer program to calculate the millions of correlation possibilities. • Output from the program can be accessed via a web form: http://pasc.met.psu.edu/PA_Climatolo gist/WDI/correlform.html • Use the best 4 predictors that can be found. The values of indices must be taken over months before the winter occurs, in order to be useful for forecasting.
Correlation coefficients • The WDI correlation calculations were done with the Pearson Correlation Coefficient (R). • 1 for a perfect correlation, 0 for no relationship what-so-ever. • > 0.6 indicate a good relationship exists between the two datasets • 0.2 to 0.6 represents a weak relationship. • The best WDI correlations fall between 0.4 and 0.6
1: Find the best predictors - ExampleEPO : WDI correlations in State College EPO is undefined in August and Sept.
For the 2002/03 winter forecast, the following predictors were used:
Next steps • Make a table of values, listing the WDI, PNA, EPO, AO, and SOI values for each year where data is available. • Obtain the index values for the current year. • Make a list of analog years where the current index values match previous years • Also keep track of how many indices each analog year matched • Take a weighted average of the analog years WDI values.
2002-03 Analog years Listing of analog years, which matched one (single) index two (double) atmospheric/oceanic indices Taking the weighted average of each analog winter’s WDI (the double match years are double weighted), gives the value of roughly: WDI = -0.5 Rounded to the nearest 0.5
Oceanic/Atmospheric index method summary • More specific and calculation intensive then the 500 mb method • Correlation values may be too low to be dependable • Predicted a normal to slightly mild winter for 2002-03 • The two methods should be compared to see if they agree • Other methods not involving the WDI should be incorporated into the final forecast.
The 2002/03 winter forecast • WDI forecasted to be from 0 to 2, after considering other techniques • When the WDI is in this range, the typical conditions usually occur, typical of an average winter season in this area • -0.8 to +0.7 degree departure from average NDJFM temperature. • 34-43 inches of snowfall • 32 to 44 days with 1” snowcover • 1 major (12”+) snowstorm, or 2 moderate snowfalls • 1 storm with minor ice accumulation
STC Verification • WDI: 8.0 • Components, statistics and averages: Tmean: +1.37 (30.7 ˚F, AVG = 32.8˚ ) Smean: +2.39 (75.1”, AVG = 41”) SCmean: +1.61 (60 days SC>1”, AVG 36 days) Tdaily: +0.20 (16 DCDs, AVG of 15) Sdaily: +2.5 Rdaily: 0 Idaily: 0 • Winter as much colder and snowier then expected. Total snowfall was nearly twice the average. • However, the predication did not indicate a mild winter, which is what most people are adjusted to because of the past few years
Insight & explanations • Analog forecasts are subject to error because of the relatively short period of record of existing weather data • The WDI definition was changed since the forecast was made, values were amplified • Weak correlation values • Perhaps a component-wise analog method would be more accurate, this would also give more insight into the temperature and precipitation breakdowns • Weather patterns can change drastically over the period of 5 months • A few more methods should be developed which use the WDI to make a seasonal forecast. 2 methods may not be enough