Download
1 / 24
240 likes | 252 Views
The Scientific Method. How to solve Just About Anything. Scientific Method. Problem solving in a scientific Way Follows a specific pattern of steps. Question. What you are trying to find out. Also called “purpose” or “identify the problem” Stated in the form of a question. Research.

E N D
The Scientific Method How to solve Just About Anything
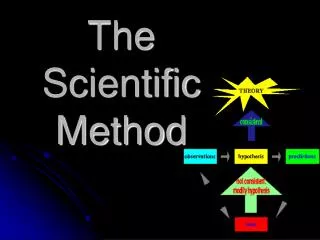
Scientific Method Problem solving in a scientific Way Follows a specific pattern of steps
Question What you are trying to find out. Also called “purpose” or “identify the problem” Stated in the form of a question Research • Gather information about the problem that will help you make a good hypothesis and design a good experiment.
Form a Hypothesis • An educated guess • A prediction that can be tested • A single experiment can never prove that something is always true, but it could prove that it is not always true. • Written in an If/then statement: • Example: If the temperature of water rises above 70 degrees, then water fleas will not mate.
Experiment • Experiments will have 2 groups • Experimental groups- the groups that receive the test (independent variables) • Control group- the group you compare the results of the experimental groups too. This group does not receive the test (independent variable)
Variables • factors that change in an experiment. • There are 2 types of variables: • Independent (aka: manilpulated) • Dependent (aka: responding) • It is very important that you only allow ONE variable to change during an experiment. • Why?
Independent variable The factor you are testing The person purposely changes or manipulates this variable in the experiment. The one and only variable that you change. Usually expressed after the word “If” in the hypothesis. Dependent variable • What you measure and write down as data. • Should be charted or graphed • Usually expressed after the word “then” in the hypothesis. • This variable changes as a result of the independent variable.
Practice: Henry and Eliza conducted an experiment using plant fertilizer. They added different amounts of fertilizer to seven pots of bean sprouts. One pot did not receive fertilizer at all. The pots were the same size and had the same type and amount of soil. They were given the same amount of seeds, light, and water. To find out how the fertilizer affected the growth of the sprouts, Henry and Eliza calculated the average height of the bean sprouts in each pot. • Identify the parts of the experiment: • Independent variable: • Experimental group: • Control group: • Dependent variable: • Write a hypothesis for this experiment: amounts of fertilizer groups with fertilizer group without fertilizer average height of the bean sprout If ___________, then _________________
Identify the Variables independent variable • If a student chooses to not study, then they will earn a poor grade. • If you drink Gatorade before a soccer game, then you will score more goals. • If you increase the mechanical advantage of a pulley system used to move an object, then the input force becomes less. dependent variable independent variable dependent variable independent variable dependent variable
Constants • The variables that remain the same throughout the entire experiment. (both in the experimental and control groups)
Materials Detailed list of everything you need to conduct the experiment Should include amounts Procedures • Step-by-step instructions for how to conduct the test. • Should be detailed enough that someone else could follow them and do exactly what you did. • The experiment should be repeated at least twice for valid results. • Each time the experiment is done is called a trial.
Recording Data • Very careful recording is important for valid results • Use charts or tables to organize data • Record measurements as well as observations and things you want to remember about what happened • Types of Data: Qualitative & Quantitative • Qualitative: describes with words. Ex: color or shape • Quantitative: describes with numbers Ex: 50 mi/hr or 67meters
Analyze the Results What are your results? Create charts, tables and graphs to represent all of your data. Perform any calculations that will help you determine what the results mean (averages, percentages, totals) What are your possible sources of error (things that could make your results wrong) Inaccurate measurements, contamination, human error, etc
Draw Conclusions What is the answer to your question based on your results? Was your hypothesis supported ? Why or why not? If you did this experiment again what would you do differently? Answer questions. (lab questions)
Your results are not valid if… They are based on opinions rather data You draw conclusions that don’t logically follow from the evidence You over-generalize (make a rule based on just a few observations) Your sample size is too small or is biased You did not have a control group to use for comparison.
Scientific Theory An explanation of something based on scientific knowledge that is the result of many observations and experiments. Its not a guess or someone's opinion If data collected form several experiments over a period of time all support the hypothesis, it finally can be called a theory. Theories can change as new knowledge is gained from additional experiments.
Scientific Law A scientific law is a statement about how things work in nature that seems to be true all the time. They do not change like theories can. Laws tell you what will happen under certain conditions but do not necessarily explain why it happened.
Branches of Science --usually ends in “ology” BiologyPhysics ZoologyChemistry Ecology Botany MeteorologyAstronomy GeologyOceanography Pathology
Presenting Scientific Data • Line graphs – data that change • Independent variable – one you set (x-axis) • Dependent variable – changes in response to independent (y-axis), one you measure
Line Graph shows the relationship between 2 variables Dependent Variable Independent Variable
Other types of graphs • Bar graphs – compare data for several items/events • Pie charts – display data that are parts of a whole
Bar Graph • shows information collected by counting
Pie Graph • shows distribution of parts within a whole quantity