Download
1 / 19
190 likes | 377 Views
This presentation will probably involve audience discussion, which will create action items. Use PowerPoint to keep track of these action items during your presentation In Slide Show, click on the right mouse button Select “Meeting Minder” Select the “Action Items” tab

E N D
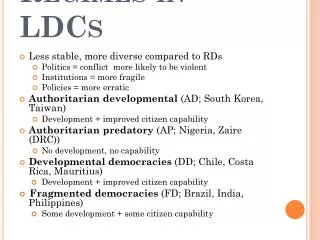
This presentation will probably involve audience discussion, which will create action items. Use PowerPoint to keep track of these action items during your presentation • In Slide Show, click on the right mouse button • Select “Meeting Minder” • Select the “Action Items” tab • Type in action items as they come up • Click OK to dismiss this box • This will automatically create an Action Item slide at the end of your presentation with your points entered. PPI in LDCs Antonio Estache World Bank and ECARES, Université Libre de Bruxelles November 2006
Historical Context(Late 80s-mid 90s) • Major Fiscal Crisis • Lack of Investment in public services • Declining service quality • Excess supply of funds on international capital markets • Ideological changes favoring market driven economies among leaders of all political sides • Widespread popular support for reforms including privatization & creation of independent regulator
The promises of PPI • Contribution to fiscal stabilization • Efficiency gains • Increased investments • Growth payoffs • Contribution to poverty reduction • Improved governance
To what extent were goals achieved? (1) • Fiscal benefits:yes in short run, more complex in long run • Short run: sales of assets and reductions from transfer of Opex and capex obligations to private operators • Long run: renegotiations associated with increased changes on fiscal effects of reforms • Return of capex subsidies in utilities • Return of opex subsidies in passenger transport
To what extent were goals achieved? (2) • Efficiency gains:ok in general • Lots of evidence from partial performance indicators • Confirmed by papers looking at economic concepts of efficiency (TFP, TE, TEC) • Noteworthy: • evidence of changes in allocative efficiency changes for a few papers on electricity • Evidence that regulatory regime drives efficiency often more than ownership • No difference in water • Major difference in rail and ports • Jury still out on energy
To what extent were goals achieved? (3) • Investment:not clear • Fast increase till 1997, decline since, some recovery in last 2 years • Not as much as expected • Drop in CAPEX from 8-10% in 1970s to 1-3% since mid 1990s • And it is not only a result of efficiency gains • Not as private as expected (mostly in middle income countries) • 20% of the actual investments in the sector • 10% of the needs • Significant cream-skimming problems: • Typically urban better off than rural
How much investment is taking place? * Assuming developing countries invested around 4% of their GDP in infrastructure (WDR 94). Investment flows to PPI include only investment in facilities (sector expansion). Investment in acquiring government assets have been excluded.
To what extent were goals achieved? (4) • Growth payoffs:not clear • Direct effect of PPI generally non-significant • But…strong evidence that infrast. matters in LDCs • But lower investment/cream skimming linked to lower growth for utilities; • Positive payoff from freight transport reforms • Useful counterfactual studies on growth consequences of infrastructure gaps associated with reforms • See various papers in Easterly and Serven (2003)
To what extent were goals achieved? (5) • Improved governance:not clear • Institutional changes tend to be associated with better outcomes in terms of access • High renegotiation rates (Guasch (2004) • Yet corruption continues to be an issue
So who gained and who lost from these mixed outcomes? • Three ways of looking at it: • Regions • Sectors • Actors
Winners and losers by Actors • The actors in the payoff matrix • The users (access: (+ but not as much as expected and distributional issues), affordability(-), quality (+)) • The taxpayers (cash!: + in SR, -/+ in LR) • The workers (jobs + cash: - in SR, + in LR) • The operators (cash in the SR and IRR> COC in the LR for a few! (+ in SR, ? for LR) • The local owners (cash! + in SR and LR) • The foreign owners (cash! + in SR, +/- in LR) • The bankers (cash! + in SR and LR) • The politicians (cash! + in SR and LR) • The donors (???)
Concluding comments • Globally: net welfare impact seems to be globally positive but distributional issues have been really poorly addressed • THERE ARE EQUITY-EFFICIENCY TRADE-OFFS! • Main tough challenges: • Actually addressing the distributional implications • Strategic behavior of actors (demand and costing games) • Dealing with renegotiation and FOREX risks • Water and some of the transport sectors where cost of capital too high for viable average tariffs • New macro teams seeing long term fiscal costs • People fed up with corruption issues • …people interested in new sources of rent… • NGOs • Change in ideology • … main issue really is…the need for a political commitment on the parts of ALL actors
THANK YOU FOR YOUR PATIENCE