Download
1 / 29
310 likes | 571 Views
Perfect Competition - Price Takers. The individual firm produces such a small portion of the total market output that it cannot influence the price it charges for the product it sells.

E N D
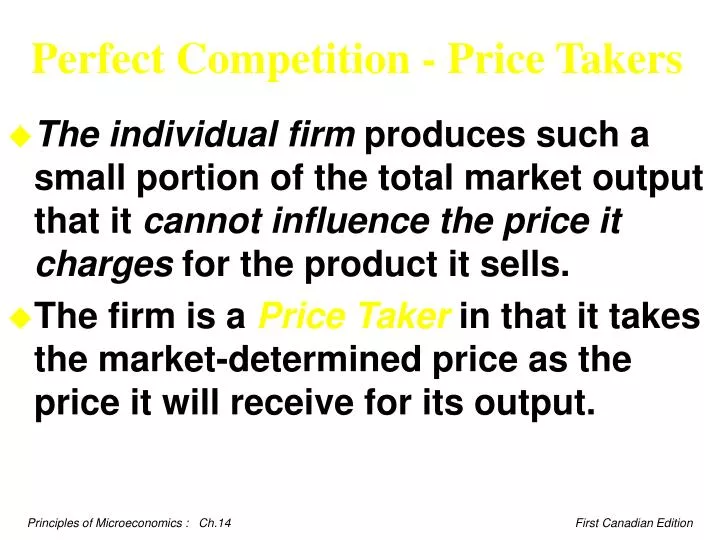
Perfect Competition - Price Takers • The individual firm produces such a small portion of the total market output that it cannot influence the price it charges for the product it sells. • The firm is a Price Takerin that it takes the market-determined price as the price it will receive for its output.
The Revenue of a Competitive Firm • Total Revenue for a firm is the market selling price times the quantity sold. TR = (P x Q) • Total revenue is proportional to the amount of output. • Graphically: Total revenue increases at a constant rate, as each unit sold sells for a constant price.
Total Revenue: Competitive Firm $ Total Revenue $25 $20 At a market price of $5, total revenue is ($5x1) = $5! $15 $10 $ 5 Quantity 1 2 3 4 5
Alternative Measurements of Revenue • Average Revenue: • Tells us how much revenue a firm receives for the typical unit sold. AR = TR ÷ Q • Average Revenue equals the Price of the good, in Perfect Competition.
Alternative Measurements of Revenue • Marginal Revenue: • Tells us how much revenue a firm receives for one additional unit of output. MR = TR ÷ Q • Marginal Revenue equals the Price of the good, in Perfect Competition. • Graphically: Each unit sold will add the same amount to total revenue, $5!
Total Revenue: Competitive Firm $ Total Revenue $25 $20 $15 $10 Marginal Revenue $ 5 Quantity 1 2 3 4 5
Profit Maximization Total Cost $ $25 $20 $15 $10 $ 5 Quantity 1 2 3 4 5
Profit Maximization Total Cost $ Total Revenue $25 $20 $ Maximum Profit at Q = 3 units! } $15 $10 $ 5 Quantity 1 2 3 4 5
Profit Maximization • Maximum profits occur at a quantity that maximizes the difference (distance) between revenue and costs.
The Competitive Firm’s Cost Curves • Revisit of average cost curves: • The marginal-cost curve (MC) eventually increases. • The average-total-cost curve (ATC) is U-shaped. • Marginal Cost crosses the Average-Total-Cost at the minimum ATC. • Graphically. . .
The Shape of Typical Cost Curves MC ATC AVC Cost ($’s) Quantity
The Competitive Firm’s Profit- Maximizing Output • Add a line for the market price which is the same as the firm’s average revenue (AR) and its marginal revenue (MR). • Identify the level of output that maximizes profit.
The Competitive Firm’s Profit- Maximizing Output Price MC ATC P=MR=AR AVC Quantity QMax
The Competitive Firm’s Profit- Maximizing Output Price MC ATC P P=MR=AR AVC ATC Maximum Profit Quantity QMax
The Competitive Firm’s Shut-Down Decision • Alternative levels of output produced because the firm is a price taker. • If the selling price is below the minimum average variable cost, the firm should shut-down! • The minimumloss would equal to the firm’s Total Fixed Cost.
Shut-Down! Costs are greater than market price Price MC ATC AVC Q Don’t Produce! P=MR=AR Loss in Excess of Fixed Costs Quantity
Short-Run Production Minimize Losses when MR = MC Price MC ATC AVC ATC P P=MR=AR Losses are less than fixed costs Quantity Q short-run
Short-Run Production Maximize Profits when MR = MC Price MC ATC P P=MR=AR ATC AVC Maximum Economic Profit Quantity QMax
Long-Run Production Normal Profits when MR = MC • In the long-run the typical firm will operate where: • MR = MC • Normal Profit where Price = ATC • Minimum ATC • Why? • Due to Easy Entry • Due to Intense Competition
Long-Run Production Normal Profits when MR = MC Price ATC MC P=MR=AR Quantity QLR
The Competitive Firm’s Supply Curve • Short-Run Supply: • Is the portion of its marginal cost curve that lies above average variable cost. • Long-Run Supply: • Is the marginal cost curve above the minimum point of its average total cost curve.
Competitive Firm’s SR Supply Curve Price MC ATC P=MR=AR AVC P1 Quantity Q1
The Competitive Firm’s Supply Curve Price MC ATC P3 P=MR=AR AVC P2 P1 Quantity Q1 Q2 Q3
The Competitive Firm’s Supply Curve Price P3 } P2 Firms Short- Run Supply Curve P1 Quantity Q1 Q2 Q3
The Firm’s Profit • Profit equals total revenue (TR) minus total costs (TC) • Profit = TR - TC • Profit = ([TR ÷ Q] - [TC ÷ Q]) x Q • Profit = (P - ATC) x Q
The Competitive Firm’s Decision To Produce, Shut-Down or Exit • In the short-run, a firm will choose to shut-down temporarily if the price of the good is less than the average variable cost. • In the long-run when the firm can recover both fixed and variable costs, the firm will choose to exit if the price is less than average total cost.
The Market Supply Curve • For any given price, each firm supplies a quantity of output so that price equals its marginal cost. • The quantity of output supplied to the market equals the sum of the quantities supplied by the individual firms.
The Market Supply Curve • Firms will enter or exit the market until profit is driven to zero. In the long-run, price equals the minimum of average total cost. • Because firms can enter and exit more easily in the long-run than in the short-run, the long-run supply curve is more elastic than the short-run supply curve.
Summary/Conclusion • If business firms are competitive and profit-maximizing, the price of a good equals the marginal cost of making that good. • If firms can freely enter and exit the market, the price also equals the lowest possible average total cost of production.