Download
1 / 30
310 likes | 502 Views
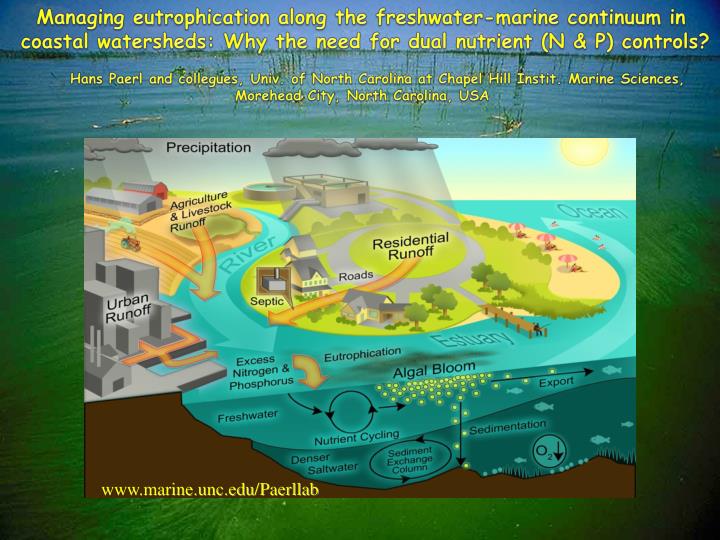
Managing eutrophication along the freshwater-marine continuum in coastal watersheds: Why the need for dual nutrient (N & P) controls? Hans Paerl and collegues , Univ. of North Carolina at Chapel Hill Instit . Marine Sciences, Morehead City, North Carolina, USA.

E N D
Managing eutrophication along the freshwater-marine continuum in coastal watersheds: Why the need for dual nutrient (N & P) controls? Hans Paerl and collegues, Univ. of North Carolina at Chapel Hill Instit. Marine Sciences, Morehead City, North Carolina, USA www.marine.unc.edu/Paerllab
Human nutrient over-enrichment in coastal watersheds There’s a long history Salomon van Ruysdael 1648
Choptank R, Chesapeake Bay Mississippi R. Basin Taihu Basin Atmospheric N input And more recent trends
Nutrient-eutrophication dynamics along the freshwater-marine continuum representing coastal watersheds Dogma: Primary production controlled by P availability in freshwater, N in marine ecosystems. However: Accelerating anthropogenic N & P loading has altered nutrient limitation and eutrophication dynamics Results: Human-impacted systems reveal a complex picture and a challenge to nutrient management
Estuarine and coastal systems: What do the data tell us? DIN Loading vs. primary production in a range of N. American and European estuaries Nixon 1996
However: N +P enrichment is often most stimulatory: Nutrient stimulation of primary production in the brackish Baltic Sea Moisander et al. 1994; 2003
Nutrient limitation dynamics in the Chesapeake Bay Fisher et al. 1998 Chesapeake (Fisher et al. 1998)
Nutrient limitation in the Neuse R.Estuary,NC Chlorophyll (μg / L) Neuse R. Estuary Paerl et al., 1995; Gallo 2006
Effects of Upstream P reduction but no parallel N reduction on the Neuse River Estuary, NC phytoplankton biomass (Chl a) • P detergent ban, WWT improvements
Has Freshwater P Reduction w/o Parallel N Reduction Exacerbated Estuarine Eutrophication? What’s the mechanism?
Human Impacts on Nutrient Limitation along the FW to Marine Continuum The Mississippi R./Delta/Gulf of Mexico May 2001 DIN:P RATIO DIN:P ratios on the shelf are very high, compared with Redfield values (16 N:1 P)
May 01 bioassay: Only treatments containing P led to increases in Chl a. Sylvan et al. 2006
Conclusions Excessive anthropogenic N loading has led to P limited conditions in spring. Spring bloom is controlled by P supplies. N limitation persisted in summer. Management option: Reduce BOTH N and P inputs to control eutrophication and hypoxia Sylvan et al. 2006; EPA SAB 2009
Nutrient load and phytoplankton growth response in Himmerfjärden, Sweden Courtesy: Ulf Larsson & Ragnar Elmgren Stockholm University
The Himmerfjärden case:Coastal area with large Sewage treatment plant, P removal since 1976, N removal started in 1993 (50%) & 2000 (80%). No N removal 2004-2008 RESULTS ON PHYTOPLANKTON (Chl a)? Plant loads , tonnes/ year H4 B1 H4 =Eutrophicated station B1= Reference station
Developing a N loading-bloom threshold Lowering nitrogen discharge below 400 tonnes/yr clearly reduced local phytoplankton biomass. Source: Ulf Larsson, pers.comm.
Yangtze River Delta System, China The contemporaneous effects of damming and nutrient enrichment Chai et al., Sci. Total Environ. 2009
Eutrophication of a Large Coastal Plain Lake: Taihu, China’s 3rd largest Lake. Both N and P inputs increased dramatically in the past 3 decades
Nutrient dynamics in Taihu N & P inputs exceed what’s needed for balanced algal growth. Result: “Runaway” eutrophication & toxic CyanoHABs A B C • Nutrient (N&P) ratios in Taihu • Redfield (balanced growth) • 15:1 (N:P) • HYPOTHESIS • Dual (N & P) reductions will be • needed to stem eutrophication • and CyanoHABs Xu et al., 2010
Effects of nutrient (N & P) additions on phytoplankton production (Chl a) in Lake Taihu, China: Both N & P inputs matter!! Xu et al. 2010; Paerl et al. 2011
Why doesn’t N2 fixation support the N requirements in the marine to freshwater continuum? Despite highly favorable N:P ratios (< 5:1) • Examples: N limited lakes, estuarine, coastal and open ocean systems • W. Atlantic-Gulf Stream (oligotrophic) • Baltic Sea (mesotrophic) • Neuse River Estuary, NC (eutrophic) • Lake Taihu, China (hypereutrophic)
energy constraints Fe limitation O2 Controls on N2 fixation, it isn’t just P or N:P…Other controls Photosynthesis Heterotrophy Chemolithotrophy 2 Fe Mo (V) MW=245 KD 4 Fe S MW=60.5 KD
The Baltic Sea: N2 fixers, but rates don’t meet ecosystem N demands ~ 30% (Elmgren and Larsson 2001; Wulff et al. 2006)
Also, N2 losses from shallow eutrophic systems exceed “new” N inputs via N2 fixation • Conclusions: 1. N2 fixation does NOT meet ecosystem N demands • More N inputs will accelerate eutrophication • We Gotta get serious about controlling N!!
N limited or N/P co-limited Howarth et al. 1998; Capone et al. 2004; Paerl and Scott 2010
Conclusions/Implications Primary production controlled by P availability in many freshwater systems. However, some are N & P co-limited or N limited. In Estuarine/Coastal systemsN limitation prevails. However, heavily N impacted systems can be P limited or N & P co-limited. N2 fixation does not meet ecosystem N requirements: External N inputs can enhance primary production/eutrophication Expanding human water- and airshed activities have greatly increased N & P loading and altered nutrient limitation Consider impacts of freshwater nutrient management on downstream marine nutrient limitation/eutrophication dynamics (along the freshwater-marine continuum).
Estuarine & Coastal Indicators of Nutrient Enrichment www.unc.edu/ims/paerllab/ Thanks to: J. Ammerman T. Fisher A. Joyner B. Peierls M. Piehler B. Qin K. Rossignol H. Xu G. Zhu 82667701 USDA, USDOD, Chinese Academy of Sciences