Download
1 / 4
0 likes | 3 Views
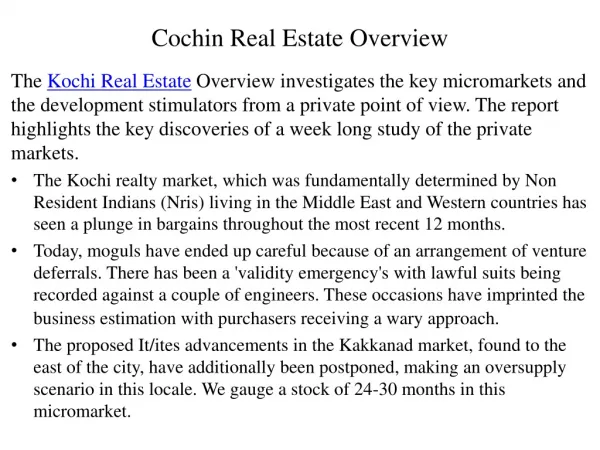
In the year of 2024, the Real Estate market in Downtown Los Angeles continued to navigate through fluctuating economic conditions, including stabilizing interest rates and a cautious approach from both buyers and sellers. Sales velocity remained subdued, with the average days on the market for properties reflecting a market that is still recalibrating from recent years. Compared to 2023, total sales in Downtown LA saw a slight contraction, reinforcing a trend of tempered activity within the sector. For more information visit us : https://loftway.com/report/

E N D
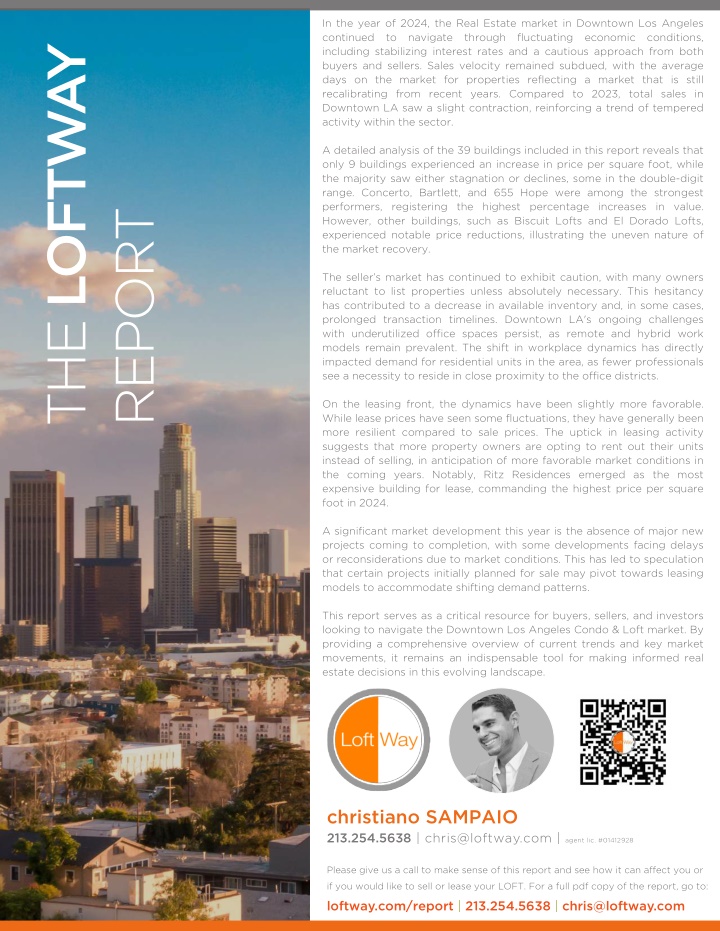
In the year of 2024, the Real Estate market in Downtown Los Angeles continued to navigate through fluctuating economic conditions, including stabilizing interest rates and a cautious approach from both buyers and sellers. Sales velocity remained subdued, with the average days on the market for properties reflecting a market that is still recalibrating from recent years. Compared to 2023, total sales in Downtown LA saw a slight contraction, reinforcing a trend of tempered activity within the sector. THE LOFTWAY A detailed analysis of the 39 buildings included in this report reveals that only 9 buildings experienced an increase in price per square foot, while the majority saw either stagnation or declines, some in the double-digit range. Concerto, Bartlett, and 655 Hope were among the strongest performers, registering the highest percentage increases in value. However, other buildings, such as Biscuit Lofts and El Dorado Lofts, experienced notable price reductions, illustrating the uneven nature of the market recovery. REPORT The seller’s market has continued to exhibit caution, with many owners reluctant to list properties unless absolutely necessary. This hesitancy has contributed to a decrease in available inventory and, in some cases, prolonged transaction timelines. Downtown LA's ongoing challenges with underutilized office spaces persist, as remote and hybrid work models remain prevalent. The shift in workplace dynamics has directly impacted demand for residential units in the area, as fewer professionals see a necessity to reside in close proximity to the office districts. On the leasing front, the dynamics have been slightly more favorable. While lease prices have seen some fluctuations, they have generally been more resilient compared to sale prices. The uptick in leasing activity suggests that more property owners are opting to rent out their units instead of selling, in anticipation of more favorable market conditions in the coming years. Notably, Ritz Residences emerged as the most expensive building for lease, commanding the highest price per square foot in 2024. A significant market development this year is the absence of major new projects coming to completion, with some developments facing delays or reconsiderations due to market conditions. This has led to speculation that certain projects initially planned for sale may pivot towards leasing models to accommodate shifting demand patterns. This report serves as a critical resource for buyers, sellers, and investors looking to navigate the Downtown Los Angeles Condo & Loft market. By providing a comprehensive overview of current trends and key market movements, it remains an indispensable tool for making informed real estate decisions in this evolving landscape. christiano SAMPAIO 213.254.5638 | chris@loftway.com | agent lic. #01412928 Please give us a call to make sense of this report and see how it can affect you or if you would like to sell or lease your LOFT. For a full pdf copy of the report, go to: loftway.com/report | 213.254.5638 |chris@loftway.com
Loft & Condo Sales 2024 Buildings # of Sales DOM $ / SQ. FT. 2023 $ / SQ. FT. 2024 % Change 56 68 43 19 - 69 35 99 84 161 96 116 126 17 41 70 51 - 51 47 58 45 90 56 77 60 177 23 102 60 34 93 104 101 115 - 69 4 83 72 -0.50% -0.08% 11.81% 0.63% - % 0.70% 4.61% 14.23% 4.64% -12.84% 15.05% -19.79% -4.89% -16.22% 0.38% -10.46% -3.77% 0.00% -3.45% 1.78% -18.39% -0.28% 9.03% -3.90% -8.14% 1.83% -% 1.86% 2.74% -4.16% -6.08% 1.39% -9.87% 8.97% -9.37% % -24.77% -19.33% -8.05% -3.92% Ten50 Grand 1100 Wilshire 655 Hope 939 Broadway 940 E 2nd Alta Lofts Barker Block Bartlett Beacon Biscuit Lofts Concerto Douglas Building Eastern Columbia El Dorado Lofts Elleven South Evo South Flower Lofts Gallery Lofts Grand Lofts Higgins Lofts Library Court Little Tokyo Lofts Luma South Market Lofts Metropolis Molino Lofts Pan American Lofts Perla Ritz Residences Rowan Lofts Santee Cornell Santee Eckard Santee Textille Sb Grand Sky Lofts The Tomahawk Toy Factory Toy Warehouse Vero Total/Average 7 12 5 5 0 6 15 4 3 4 2 3 6 1 4 16 5 0 2 3 3 2 7 15 18 5 2 15 11 6 5 4 1 7 6 - 5 1 10 280 $872.65 $655.88 $593.67 $790.07 - $489.12 $727.12 $636.74 $689.15 $1,097.11 $609.83 $706.39 $685.15 $627.43 $591.25 $679.39 $501.42 $711.15 $627.24 $556.36 $567.86 $530.83 $692.95 $616.02 $913.91 $636.04 - $971.69 $885.43 $687.24 $593.52 $529.38 $638.83 $514.39 $583.45 - $892.18 $643.02 $600.98 $676.25 $868.25 $655.35 $663.78 $795.02 - $492.55 $760.64 $727.35 $721.15 $956.28 $701.58 $566.60 $651.67 $525.64 $593.49 $608.32 $482.53 - $605.60 $566.27 $463.45 $529.37 $755.52 $592.00 $839.55 $647.66 $560.24 $989.78 $909.71 $658.64 $557.41 $536.74 $575.76 $560.53 $528.77 - $671.19 $518.72 $552.58 $649.71 The Loftway Report is based on data collected from the CLAW MLS™ it features the majority of sales in each building, pocket listings, and off-market deals are excluded but do not affect the accuracy of the report. All material herein is intended for information purposes only and has been compiled from sources deemed reliable. Though information is believed to be correct, it is presented subject to errors, omissions, changes or withdrawal without notice.
Loft & Condo Leases 2024 Buildings # of Leases DOM $ / SQ. FT. 2023 $ / SQ. FT. 2024 % Change 81 54 36 128 55 46 38 84 40 52 62 63 56 60 36 61 45 45 72 73 41 49 90 66 49 54 25 72 91 74 79 114 84 89 69 117 72 - 54 65 19 16 3 2 2 3 17 8 6 9 4 4 20 2 9 26 6 3 4 10 6 9 15 16 50 9 3 17 11 17 9 1 5 5 9 1 8 0 10 374 Ten50 Grand 1100 Wilshire 655 Hope 939 Broadway 940 E 2nd Alta Lofts Barker Block Bartlett Beacon Biscuit Lofts Concerto Douglas Building Eastern Columbia El Dorado Lofts Elleven South Evo South Flower Lofts Gallery Lofts Grand Lofts Higgins Lofts Library Court Little Tokyo Lofts Luma South Market Lofts Metropolis Molino Lofts Pan American Lofts Perla Ritz Residences Rowan Lofts Santee Cornell Santee Eckard Santee Textille Sb Grand Sky Lofts The Tomahawk Toy Factory Toy Warehouse Vero Total/Average $3.64 $3.36 $3.11 $3.78 $3.19 $2..47 $3.18 $3.01 $3.01 $4.22 $3.00 $2.82 $3.00 $2.80 $3.06 $3.13 $2.41 $3.75 $2.72 $2.97 $3.04 $2.87 $3.23 $3.12 $4.08 $2.53 $2.88 $4.35 $4.45 $3.25 $3.14 $3.03 $3.05 $2.77 $3.02 $3.02 $3.34 - $2.92 $3.17 $3.63 $3.37 $2.85 $3.44 $3.27 $3.00 $3.35 $3.13 $3.21 $3.31 $3.01 $3.22 $2.98 $3.15 $2.84 $3.04 $2.63 $2.88 $2.52 $3.10 $3.18 $2.53 $2.94 $3.06 $4.07 $3.17 $3.36 $4.03 $4.75 $2.96 $2.94 $2.75 $2.48 $2.95 $2.84 $2.20 $3.36 - $2.80 $3.11 -0.27% 0.30% -8.36% -8.99% 2.51% 21.46% 5.35% 3.99% 6.64% -21.56% 0.33% 14.18% -0.67% 12.50% -7.19% -2.88% 9.13% -23.20% -7.35% 4.38% 4.61% -11.85% -8.98% -1.92% -0.25% 25.30% 16.67% -7.36% 6.74% -8.92% -6.37% -9.24% -18.69% -6.50% -5.96% -27.15% 0.60% -% -4.11% -2.00% The Loftway Report is based on data collected from the CLAW MLS™ it features the majority of sales in each building, pocket listings, and off-market deals are excluded but do not affect the accuracy of the report. All material herein is intended for information purposes only and has been compiled from sources deemed reliable. Though information is believed to be correct, it is presented subject to errors, omissions, changes or withdrawal without notice.
Loft & Condo Sales 2024 39 Number of Buildings in the Report Lofts Sold AVG. $ / SQ. FT. Days On The Market 280 7 72 2 DAYS $6 64 49 9. .7 71 1 37 74 4 Number of Leases Top 5 Buildings By Price Per Sq. Ft. $989 $956 Most Expensive Least Expensive $909 $868 $839 $4.75 $2.20 BICUITCO PERLA METROPOLIS TEN50 RITZ THE RITZ TOMAHAWK Bottom 5 Buildings By Price Per Sq. Ft. *Building for Lease by Price Per SQ. Ft. $463 $482 Building With Highest Percentage Increase $/SF From Last Year $492 $518 $528 15.05% 14.23% 11.81% TOY LIBRARY COURT ALTA LOFTS SKY LOFTS FLOWER LOFTS WAREHOUSE HIGHEST SALE OF THEYEAR: RITZ $7,750,000 LOWEST SALE OF THEYEAR: LIBRARY COURT$208,000 CONCERTO 655HOPE BARTLETT The Loftway Report is based on data collected from the CLAW MLS™ it features the majority of sales in each building, pocket listings, and off-market deals are excluded but do not affect the accuracy of the report. All material herein is intended for information purposes only and has been compiled from sources deemed reliable. Though information is believed to be correct, it is presented subject to errors, omissions, changes or withdrawal without notice.