Download
1 / 23
940 likes | 4.24k Views
Cluster sampling. DEFN: A cluster is a group of observation units (or “elements”). Cluster sample. DEFN: A cluster sample is a probability sample in which a sampling unit is a cluster. Cluster sample – 2 . 1-stage cluster sampling

E N D
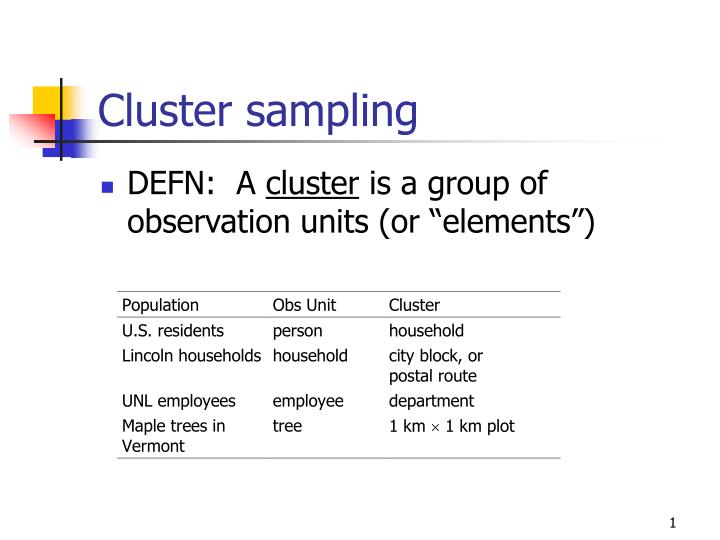
Cluster sampling • DEFN: A cluster is a group of observation units (or “elements”)
Cluster sample • DEFN: A cluster sample is a probability sample in which a sampling unit is a cluster
Cluster sample – 2 • 1-stage cluster sampling • Divide the population (of N elements) into NI clusters (of size Ni for cluster i) • Cluster = group of elements • An element belongs to 1 and only 1 cluster • Sampling unit • Cluster = group of elements = PSU = primary sampling unit • Can use any design to select clusters (ST, PPS) • Data collection • Collect information on ALL elements in the cluster
Sample of 40 elements 1-stage CS ST A block of cells is a cluster A block of cells is a stratum SU is a cluster Don’t sample from every cluster SU is an element (or OU) Sample from every stratum
Cluster vs. stratified sampling • Cluster sample • Divide N elements into NI clusters • Cluster or PSU i has Ni elements • Take a sample of nIclusters • Stratified sampling • N elements divided into H strata • An element belongs to 1 and only 1 stratum • Take a sample of nelements, consisting of nh elements from stratum h for each of the H strata
Cluster sample – 3 • 2-stage cluster sampling • Process • Select PSUs (stage 1) • Select elements within each sampled PSU (stage 2) • First stage sampling unit is a … • PSU = primary sampling unit = cluster • Second stage sampling unit is a … • SSU = secondary sampling unit = element = OU • Only collect data on the SSUs that were sampled from the cluster
1-stage vs. 2-stage cluster sampling 1-stage cluster sample (stop here) OR Stage 1 of 2-stage cluster sample(select PSUs) Stage 2 of 2-stage cluster sample (select SSUs w/in PSUs)
Why use cluster sampling? • May not have a list of OUs for a frame, but a list of clusters may be available • List of Lincoln phone numbers (= group of residents) is available, but a list of Lincoln residents is not available • List of all NE primary and secondary schools (= group of students) is available, but a list of all students in NE schools is not available • May be cheaper to conduct the study if OUs are clustered • Occurs when cost of data collection increases with distance between elements • Household surveys using in-person interviews (household = cluster of people) • Field data collection (plot = cluster of plants, or animals)
Defining clusters due to frame limitations • A cluster (or PSU) is a group of elements corresponding to a record (row) in the frame • Example • Population = employees in McDonald’s franchises • Element = employee • Frame = list of McDonald’s stores • PSU = store = cluster of employees
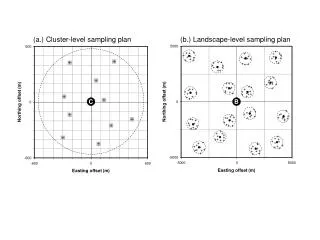
Defining clusters to reduce travel costs • A cluster (or PSU) is a group of nearby elements • Example • Population = all farms • Element = farm • Frame = list of sections (1 mi x 1 mi areas) in rural area • PSU = section = cluster of farms
Cluster samples usually lead to less precise estimates • Elements within clusters tend to be correlated due to exposure to similar conditions • Members of a household • Employees in a business • Plants or soil within a field plot • We are getting less information than if selected same number of unrelated elements • Select sample of city blocks (clusters of households) • Ask each household: • Should city upgrade storm sewer system? • PSU (city block) 1 • No storm sewer households will tend to say yes • PSU (city block) 2 • New development households will tend to say no
Defining clusters for improved precision • Define clusters for which within-cluster variation is high (rarely possible) • Make each cluster as heterogeneous as possible • Like making each cluster a mini-population that reflects variation in population • Minimizes the amount of correlation among elements in the cluster • Opposite of the approach to stratification • Large variation among strata, homogeneous within strata • Define clusters that are relatively small • Extreme case is cluster = element • Decreasing the number of correlated observations in the sample
Example for single-stage cluster sampling w/ equal prob (CSE1) • Dorm has NI= 100 suites (clusters) • Each suite has Ni= 4 students (4 elements in cluster i , i = 1, 2, … , NI) • Note that there are • Take SRS nI= 5 suites (clusters) • Ask each student living in each of the 5 suites • How many nights per week do you eat dinner in the dining hall? • Will get observations from a sample of 20 students = 5 suites x 4 students/suite
Dorm example – 3 • SRS of nI= 5 dorm rooms • Data on each cluster (all students in dorm room) • ti = total number of dining hall dinners for dorm room i • t2 = 14 dining hall dinners for 4 students in dorm room 2 • Estimated total number of dining hall nights for the dorm students • HT estimator of total = pop size x sample mean (of cluster totals)
Notation • Response variable for SSU j in PSU i • yij • e.g., age of j-th resident in household i • e.g., whether or not dorm resident j in room i owns a computer
Cluster-level population parameters (for cluster i ) Nielements • Cluster size = • Cluster population total • Note that we observe cluster population total (or mean or variance) for each sample cluster in 1-stage cluster sampling • We will estimate cluster parametersin 2-stage cluster sampling
Popuation 1-stage cluster sample
Data from cluster samples • Work with element and cluster-level data • Element data set will have columns for • Cluster id • Element id within cluster • Variable (y) • Will also summarize this data set to generate cluster parameters (1-stage) or estimates of cluster parameters (2-stage) • Cluster id • Cluster total (or estimate) • Cluster mean (or estimate) • Cluster variance (or estimate)
CSE1 unbiased estimation under SI – total t • Estimator for population total using data collected from a 1-stage cluster sample • SI of clusters • Estimator of variance of
Dorm example – 4 • Estimated population total • Estimated variance
Dorm example – 5 • Inclusion probability for student j in dorm room i • N = 100 dorm rooms • n = 5 sample dorm rooms • Take all 4 students in dorm room • ij = nI/ NI = 1/20 = 0.05