Download
1 / 70
700 likes | 761 Views
Delve into Dr. Ron Tibben-Lembke's expert guidance on impactful location decisions, tackling fixed and variable costs, transportation logistics, and more to maximize operational benefits. This comprehensive resource covers factors like skilled labor, environmental compliance, supplier proximity, and customer market access.

E N D
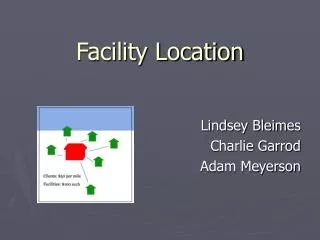
Facility Location Inventory Management Dr. Ron Tibben-Lembke
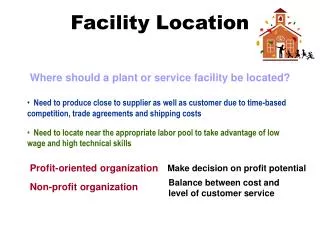
Location Decisions • Long-term decisions • Difficult to reverse • Affect fixed & variable costs • Transportation costs (25% of price) • Other costs: taxes, wages, rent • Objective: maximize benefit of location to firm
What factors should we consider? • Skilled workforce • Environmental laws / cost of compliance • Cost of utilities, labor, taxes • Suppliers close by – fast & cheap access • Customers close by • Competitors close by? Skilled labor pool • International - control issues?
Service Facilities – Traffic focus • Revenue changes a huge amount, depending on the location. • Old Navy in Stead because of cheap land? • Location, location, location: you need traffic • Make it convenient! • vitamins: need enough, but it has to be the right kind • people who would want to buy your products when they are there. • Cost probably doesn’t change nearly as much, by location • All malls have high rent
Wal-Mart Toys Party Office Max WinCo
“I-80 & McCarran” sounds great. • Kmart Sins: • Can’t see from anywhere • - see where we’re going • Very circuitous entry • feels inconvenient, no matter • how long it actually takes
Cost Focus • Revenue does not vary much, depending on the location. • Customers don’t care if your warehouse is in Sparks or Sacramento • Location is a major cost driver • Impacts shipping, labor, production costs • Varies greatly by location
Cost Minimization Identify the costs that will vary most with the location you choose. • Transportation, taxes, labor, • Facility construction cost, utilities Other considerations • Proximity of services, suppliers • Quality of life • Government incentives
Cost Focus Process Overview • Identify general region to locate in • Usually based on mostly on transp. costs • Identify a list of candidate cities • Choose cities with good transp. Access • Estimate labor cost & availability, facilities costs • Select metro area, identify candidate properties. • Find cost of building or leasing individual properties
More detail on East Coast possibilities
Interstate Detail
China to U.S. Container Rates NY / NJ $3,600 36 days Wilmington DE $3,950 36 days (door) Norfolk $3,600 34 days Charleston $3,600 35 days Atlanta $3,200 37 days (door) New Orleans $3,200 36 days
Allentown 575 305 428 DrayageRates North Elizabeth, NJ 850 295 Harrisburg 343 350 Philadelphia 305 265 375 850 Wilmington 656 825 Baltimore 305 750 375 750 780 950 1125 725 950 888 Roanoke 750 Norfolk
Landbridge Data Columbus $3000, 21days Cincinnati $2925, 21d Louisville $3050, 20d Murray $3350, 22d Nashville $3300, 22d Memphis $2900, 18.5d Atlanta $3300, 23d
Distribution Center Location • Minimize demand-weighted distance: distance to each customer times the volume of shipments to the customer • How many to build? • Where to build?
Case Study: Retailer • Location of a 5th returns processing facility • Addresses of 2125 Continental U.S. stores • Location of 4 Return Goods Processing Centers • List of all return shipments from each store, including pounds and # pallets • Calculated actual highway distances from every store to its DC
Transportation Cost Approx. • Current Pallets: 205,254 • Current Pallet Miles: 77.9m • Cost / pallet-mile 11.68 cents • Pallet-Mile = 1 pallet traveling 1 mile • Minimize average distance traveled
Solution Software • Some locations must have a facility • Considers adding a facility at every existing store • We won’t really build next to a store, but that’s ok • Finds one best facility to add • Finds second best facility to add • Reconsider first added facility, then second, etc. • Improvement heuristics, optimal methods
Location Methods • Minimize demand-weighted distance • Center of Gravity – minimizing demand-weighted distances of one facility • Ardalan – minimize transportation of multiple facilities, but must locate by customers • (P-Median Problem, Maximum Covering) • Factor Weighting – consider qualitative factors • Break-even – Consider fixed & variable costs
Center of Gravity • Compute X and Y coordinates separately • dix is the X coordinate of location i. • diy is the Y coordinate of i. • Wi is the X demand at i. • CX and CY are the coordinates of the DC.
Center of Gravity Example 1 • You need to decide where to build a new DC for Motorola. • It needs to serve wholesalers in Reno, Dallas, and Chicago. • Locate these cities on an unscientific, rectangular grid. • Grid must maintain relative distances, but X and Y grids could be different.
100 80 60 40 20 0 0 20 40 60 80 100 120 140 160
Center of Gravity Method City Demand • Reno is at 17, 55 100 • Fort Worth is at 78, 20 90 • Chicago is at 110, 65. 120 • Demand is TL/month
100 80 60 40 20 0 0 20 40 60 80 100 120 140 160
North Platte Sharon Springs Salina KS
Compromise Solution • Closest town is Sharon Springs, KN • Population 872 • 30 miles from I-70. • Probably not a good choice • Salina, KN puts us at I-70 and I-35 • North Platte NE is at I-80 and 83. • Access to Dallas less convenient
100 80 60 40 20 0 0 20 40 60 80 100 120 140 160
Finalizing City • Go where other warehouses are • More choice in pre-built buildings • Cheaper, easier to build a new one • More trucks to and from town, means more carriers there, means cheaper rates. • Backhaul situation • Get estimates of inbound, outbound trucking costs. • Provide lists of # loads per year to each destination, from each source
Center of Gravity Example 2 • You need to decide where to locate a DC in South Dakota X Y Demand • Pierre 78 47 50 • Watertown 150 65 8 • Sioux Falls 160 25 90 • Rapid 12 42 60
100 80 60 40 20 0 0 20 40 60 80 100 120 140 160
100 80 60 40 20 0 0 20 40 60 80 100 120 140 160
Ardalan Heuristic • Need a matrix of distances or costs from each customer location to every other location • Demand at each location • Weight – give higher weight to more important customers – their pain of traveling a longer distance is worth more. • Only consider locating where customers are • Identify the one best place to locate at, then the second one to add, then the third, etc.
Ardalan Heuristic • Minimize weighted distance traveled To FromA B C DDem. Weight A 0 11 8 12 10 1.1 B 11 0 10 7 8 1.4 C 8 10 0 9 20 0.7 D 9.5 7 9 0 12 1.0
Ardalan Method • Expected demand at each location. • Weight represents importance of serving location (bigger = more important) • Step 1: Multiply distances * weights * demand • A to B: 11 * 1.1 * 10 = 121
Ardalan Method Step 2. Add up values in columns FromA B C D A 0 121 88 132 B 123.2 0 112 78.4 C 112 140 0 126 D 114 84 108 0 349.2 345 308 336.4
Ardalan Method Choose smallest value as first site. FromA B C D A 0 121 88 132 B 123.2 0 112 78.4 C 112 140 0 126 D 114 84 108 0 349.2 345 308 336.4
Ardalan Method 3. If larger, set each cost equal to cost in same row in the chosen column FromA B C D A 0 88 88 88 B 112 0 112 78.4 C 0 0 0 0 D 108 84 108 0 220 172 308 166.4
Ardalan Method Get rid of previously chosen column. Sum, choose smallest sum. FromABD A 0 88 88 B 112 0 78.4 C 0 0 0 D 108 84 0 220 172 166.4
Ardalan Method Repeat 3 & 4 until enough sites chosen. FromA B D A 0 88 88 B 78.4 0 78.4 C 0 0 0 D 0 0 0 78.4 88 166.4
Ardalan Method Repeat 3 & 4 until enough sites chosen. FromA B A 0 88 B 78.4 0 C 0 0 D 0 0 78.4 88