Download
1 / 34
340 likes | 582 Views
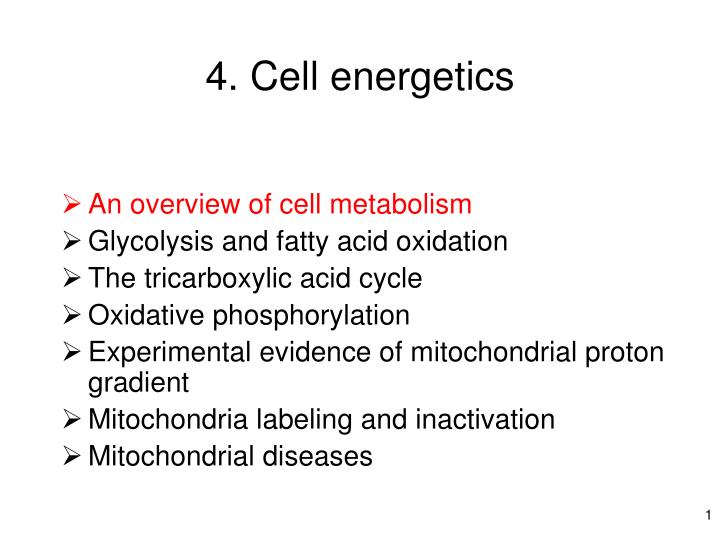
4. Cell energetics. An overview of cell metabolism Glycolysis and fatty acid oxidation The tricarboxylic acid cycle Oxidative phosphorylation Experimental evidence of mitochondrial proton gradient Mitochondria labeling and inactivation Mitochondrial diseases. ATP + H 2 O. ADP + Pi + H +.

E N D
4. Cell energetics • An overview of cell metabolism • Glycolysis and fatty acid oxidation • The tricarboxylic acid cycle • Oxidative phosphorylation • Experimental evidence of mitochondrial proton gradient • Mitochondria labeling and inactivation • Mitochondrial diseases
ATP + H2O ADP + Pi + H+ DG ≈ - 12 kcal/mole ATP + H2O AMP + PPi + H+ DG ≈ - 12 kcal/mole 2 Pi + H+ PPi + H2O DG ≈ - 12 kcal/mole ATP carries chemical energy in cells • Many intracellular chemical reactions are coupled to ATPphosphorylation-dephosphorylation • The human basal metabolic rate is about 2000 kcal/day • Cells maintain the ATP/ADP intracellular ratio of about 1000
General organization of cell metabolism Digestive tract endosomes-lysosomes hydrolysis glucose Cytosol ANAEROBIC glycolysis 2 ATP 24 kcal/mole 2 pyruvate + 6 O2 Mitochondria AEROBIC Citric acid cycle Oxidative phosphorylation 28 ATP 336 kcal/mole 6 CO2 + 6 H2O 686 kcal/mole Excretions
Triacylglycerol is an energy storage molecule adipocyte GLYCEROL FATTY ACID FATTY ACID FATTY ACID triacylglycerol + H2O glycerol + 3 fatty acids Palmitate (C16H32O2) + 23O2 16 CO2 + 16 H2O 2340 kcal/mole in mitochondria + 106 (ADP + Pi ATP) 1272 kcal/mole
Molecular intermediates in energy production fatty acids glucose ATP glycolysis b oxidation NADH pyruvate CO2 NADH acids Nicotinamide adenine dinucleotide is an intermediate electron carrier Acetyl Coenzyme A is an acetyl group carrier
Cell energetics • An overview of cell metabolism • Glycolysis and fatty acid oxidation • Tricarboxylic acid cycle • Oxidative phosphorylation • Experimental evidence of mitochondrial proton gradient • Mitochondria labeling and inactivation • Mitochondrial diseases
glucose ATP NADH pyruvate net yield + 2 ATP + 2 NADH ~ 6 ATP Glycolysis yield
Glycolysis enzymes 5 nm
pyruvate AcetylCoA Pyruvate decarboxylation E1 CO2 NADH CO2 NADH H+ CoA-SH NAD+ pyruvate dehydrogenase complex E2 Components subunits prosthetic groups E1 pyruvate 24 thiamine dehydrogenase pyrophosphate E2 dihydrolipoyl 24 lipoate transacetylase CoA E3 dihydrolipoyl 12 FAD dehydrogenase NAD+ E3 binding protein E3
The tricarboxylic acid cycle (Krebs cycle, citric acid cycle) ubiquinone (Q) ubiquinol (QH2) 2e-
citrate synthase 1csc complex II aconitase 7acn succinate dehydrogenase 2acz citrate dehydrogenase 1lwd fumarase 3e04 oxoglutarate dehydrogenase 1l1f succinyl CoA synthetase 1cqj malate dehydrogenase 4mdh
Glucose oxidation yield Complete glucose oxidation Step Metabolite ATP equivalent Total Glycolysis + 2 ATP 2 2 + 2 NADH 1.5 (2.5)3 (5) Pyruvate decarboxylation + 1 NADH 2.52.5 + 1 CO2 TCA cycle + 1 GTP 1 1 + 3 NADH 2.5 7.5 + 1 FADH2 1.5 1.5 + 2 CO2 Total 6 CO230 (32) in the presence of O2 x 2
The fatty acid cycle (beta oxydation) 1. Acyl CoA dehydrogenase 1egc 4. Acetyl-CoA C-acyl transferase 2. Enoyl CoA hydratase 1mj3 3. L-b hydroxyacyl CoA dehydrogenase 1f17
Example of a palmitate : 1. activation http://rpi.edu/dept/bcbp/molbiochem/MBWeb/mb2/part1/fatcatab.htm C16-COOH + ATP Acyl-adenylate + 2 Pi Acyl-CoA
Example of a palmitate : 2. b-oxidation fatty acids b oxidation Acetyl CoA C16 C14 C16 C14 C12 C10 C8 C6 C4 C2
Energy yield of fatty acid oxidation Step Metabolite ATP equivalent Initial fatty acid activation ATP -2 Fatty acid cycle per acetyl group for a palmitate (C16) FADH2 1.5 10.5 NADH 2.5 17.5 Acetyl CoA 10 70 Total 14 98 Last acetyl CoA 10 Total 106
Mitochondria structure Matrix: Krebs cycle, lipid beta oxidation Internal membrane: oxidative phosphorylation Inter-membrane space: nucleotide transphosphorylation External membrane: filter < 5000 Da Cytosol: glycolysis
Oxidative phosphorylation Energy coupling through a proton gradient - 53 kcal/mole Proton gradient + 12 kcal/mole 10 protons per reduced O 3 protons per phosphorylated ADP respiratory complexes ATPsynthase
The three respiratory complexes 4 H+ 4 H+ 2 H+ complex I complex III complex IV
F0 F1 Proton flow through the ATPsynthase F1F0 is coupled to ADP phosphorylation ADP + Pi Proton flow Mechanical work ATP Turnover : about 100 ADP are phosphorylated per second ATP Mechanical work Proton flow ADP + Pi
The proton motive force Free energy to transport one mole of H+ from the interspace to the matrix (electrochemical gradient) DG = NeDV - RT*ln(10) DpHmatrix-interspace DG/F = DV - RT*ln(10)/Ne DpH Proton motive force (in mV) = DY = DV - 60 DpH Some active transport processes are driven by a H+ electrochemical gradient In the mitochondria : ADP-ATP exchange, pyruvate and phosphate import In bacteria : lactose import
DG = DG’0 + RTln(C2/C1) = - nFDE’0 + RTln(C2/C1) Complex I NADH + Q + 5H+matrix→ NAD+ + QH2 + 4H+cytosol Complex III QH2 + 2Cytcox + 2H+matrix→ Q + 2Cytcred + 4H+cytosol Complex IV 2Cytcred + ½ O2 + 4H+matrix→ 2Cytcox + H2O + 2H+cytosol Net reaction NADH + ½ O2 + 11H+matrix→ NAD+ + H2O + 10H+cytosol NAD+ + 2e- + H+ → NADH E’0 = -0.32 V DG’0 = -52.6 kcal.mol-1 ½ O2 + 2H+ + 2e-→ H2O E’0 = +0.82 V NAD+/NADH ratio is about 1 [O2] is about 2 µM DG = -56.7 kcal.mol-1 10 x {H+matrix→ H+cytosol} { DpH = 1.4 DV = 0.14 V DGproton gradient = 5.2 kcal.mol-1 } 3 protons per ATP molecule 3 ATP per NADH oxidized – 0.5 ATP to transport phosphate DGADP phosphorylation= 12 kcal/mole
Electron transfer through ubiquinone (coenzyme Q) Q + 2e- + 2 H+ QH2 TCA cycle Succinate oxidation complex II (via FADH2) oxidative NADH oxidation complex I phosphorylation complex II
Electron transfer rate … depends on the distance between electron-carrying groups … depends on the free-energy of the transfer reaction Environment coupled quantum tunneling temperature sensitive Marcus’s theory : log k = 13 -0.6(R -3.6) -3.1(DG + l)2/l k is the rate in units of s-1 R is the edge-to-edge distance in Å DG is the driving force in eV l is the reorganization energy in eV quantum tunneling temperature insensitive
Cell energetics • An overview of cell metabolism • Glycolysis and fatty acid oxidation • Tricarboxylic acid cycle • Oxidative phosphorylation • Experimental evidence of mitochondrial proton gradient • Mitochondria labeling and inactivation • Mitochondrial diseases
Mesure of mitochondrial activity • O2 consumption : Clark electrode • O2 + 2 e− + 2 H2O → H2O2 + 2 OH− • ATPase activity : released Pi • Cytochrome redox state : difference spectra • NADH is detected spectroscopically at 340 nm or by its fluorescence (emission 460 nm)
In vitro reconstitution of proton gradient coupled ATP synthesis http://www.atpsynthase.info/Protocols.html#Sec1.4 • ATP hydrolysis: coupled assay Pyruvate Kinase phosphoenolpyruvate + ADP→ pyruvate + ATP Lactate dehydrogenase NADH + pyruvate → NAD+ + lactate NADH is detected spectroscopically at 340 nm or by its fluorescence (ex 340 nm, em 460 nm) • ATP synthesis: direct assay luciferase luciferin + ATP + O2→ oxyluciferin + AMP + PPi+ CO2
Functional staining of active mitochondria Bovine pulmonary endothelial cell 5 µm bull spermatozoids 10 µm
Example : Mitotracker (Molecular Probes) freely diffuses through membranes membrane impermeant complexed to proteins (fixable using formaldehyde)
Inhibitors of oxidative phosphorylation Inhibitor Target Effect Cyanide Cytochrome oxidase binds more strongly than O2 to the Fe-Cu CN- (complex IV) center, preventing O2 reduction Oligomycins ATP synthase blocks the proton flow through the F0 subunit CCCP proton gradient uncouples proton pumping from ATP synthesis malonate, succinate dehydrogenase competitive inhibitors oxaloacetate (complex II) Bongkrekic acid ADP/ATP transporter inhibitors of ADP import and ATP export through (carboxy)atractyloside the inner mitochondrial membrane Carbonyl cyanide m-chlorophenyl hydrazone Oligomycin A carboxyatractylate
Mitochondrial diseases Mitochondria contain a short (14000 bp in humans) circular chromosome, coding for 13 genes. Other proteins are synthesized in the cytoplasm and translocated across the membrane(s). Mitochondria are essentially maternally inherited. A given cell contains hundreds of different mitochondria, which may divide and fuse. Mitochondrial diseases are therefore rather complex. Fluctuations in the percentage of mutated mitochondria lead to large variations in the nature and severity of the symptoms of the pathological condition as well as the time of onset. ND : NADH dehydrogenase (complex I) CYB : cytochrome b (complex III) CO : cytochrome c oxidase (complex IV) ATP : ATP synthase
Mitochondrial disease and symptoms Molecular origin Aminoglycoside-induced deafness sensitivity of mitochondrial ribosomes to some antibiotics Kearns-Sayre syndrome partial deletion of mitochondrial DNA progressive neuromuscular disorder Leber hereditary optic neuropathy point mutation in complex I subunits progressive blindness Leigh syndrome various mutations resulting in progressive central nervous system decreased ATP production degeneration NARP (Neuropathy Ataxia mutation in ATP6 Retinitis Pigmentosa) → decreased ATP production MELAS (Mitochondrial Encephalomyopathy, A-G point mutation in the Lactic Acid accumulation, Stroke-like) tRNALeu gene → brain ischemia → brain infarct Pearson’s syndrome deletion in tRNA genes Bone marrow deficiency → low blood cell content Progressive external ophtalmoplegia deletions in mtDNA Progressive muscle paralysis
Integration of the energetic pathways in the cell metabolism glucose glycogen synthesis pentose phosphate pathway : sugars, ribose, purine metabolism glycogen glucose-6P glycogen degradation amino acid synthesis (not essential amino acids) pyruvate fatty acids synthesis acetyl-CoA fatty acids gluconeogenesis b-oxidation malate lipids amino acid degradation and urea cycle fumarate ATP pyrimidine metabolism
Arthur HARDEN Phosphorylated sugars 1865-1940, NP1929 Hans KREBS Fritz LIPMANN tricarboxylic acid cycle CoenzymeA 1900-81 1899-1986 NP1953 Peter MITCHELL chemiosmotic theory 1920-92, NP1978 NP1997 Paul BOYER John WALKER Jens SKOU ATP synthase mechanisms Na+/K+-ATPase 1918 1941 1918