Download

1 / 44
450 likes | 623 Views
Graduate School Quantitative Research Methods Gwilym Pryce. Module II Lecture 8: Categorical/Limited Dependent Variables and Logistic Regression. Notices:. Introduction. linear regression model: most commonly used statistical tool in the social sciences

E N D
Graduate School Quantitative Research Methods Gwilym Pryce Module II Lecture 8: Categorical/Limited Dependent Variables and Logistic Regression
Introduction • linear regression model: most commonly used statistical tool in the social sciences • but it assumes that the dependent variable is an uncensored “scale numeric” variable • I.e. it is continuous and has been measured for all cases in the sample • however, in many situations of interest to social scientists, the dependent variable is not continuous or measured for all cases (taken from Long, 1997, p. 1-3):
e.g. 1 Binary variables: made up of two categories • coded 1 if event has occurred, 0 if not. • It has to be a decision or a category that can be explained by other variables (I.e. male/female is not something amenable to social scientific explanation -- it is not usually a dependent variable): • Did the person vote or not? • Did the person take out MPPI or not? • Does the person own their own home or not? • If the Dependent variable is Binary then Estimate using: binary logit (also called logistic regression) or probit
e.g. 2 Ordinal variables: made up of categories that can be ranked (ordinal = “has an inherent order”) • e.g. coded 4 if strongly agree, 3 if agree, 2 if disagree, and 1 if strongly disagree. • e.g. coded 4 if often, 3 occasionally, 2 if seldom, 1 if never • e.g. coded 3 if radical, 2 if liberal, 1if conservative • e.g. coded 6 if has PhD, 5 if has Masters, 4 if has Degree, 3 if has Highers, 2 if has Standard Grades, 1 if no qualifications • If the Dependent variable is Ordinal then Estimate using: ordered logit or ordered probit
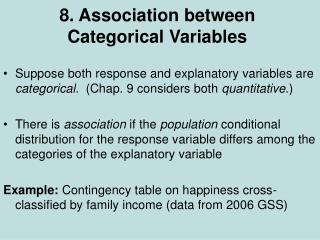
e.g.3 Nominal variables: made up of multiple outcomes that cannot be ordered • e.g. Marital status: single, married, divorced, widowed • e.g. mode of transport: car, van, bus, train, bycycle • If the Dependent variable is Nominal then Estimate using: multinomial logit
e.g. 4 Count variables: indicates the number of times that an event has occurred. • e.g. how many times has a person been married • e.g. how often times did a person visit the doctor last year? • e.g. how many strikes occurred? • e.g. how many articles has an academic published? • e.g. how many years of education has a person completed? • If the Dependent variable is a Count variable Estimate using: Poisson or negative binomial regression
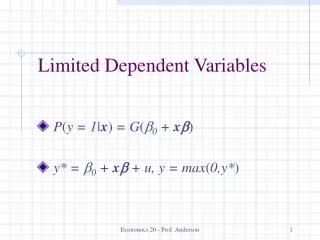
E.g 5 Censored Variables: occur when the value of a variable is unkown over a certain range of the variable • e.g. variables measuring %: censored below at zero and above at 100. • e.g. hourly wage rates: censored below by minimum wage rate. • If the Dependent variable is Censored, Estimate using: Tobit
E.g. 6 Grouped Data: occurs when we have apparently ordered data but where the threshold values for categories are known: • e.g. a survey of incomes, which is coded as follows: = 1 if income < 5,000, = 2 if 5,000 income < 7,000, = 3 if 7,000 income < 10,000, = 4 if 10,000 income < 15,000, = 5 if income 15,000 • If the Dependent variable is Censored, Estimate using: Grouped Tobit (e.g. LIMDEP)
Ambiguity: • The level of measurement of a variable is sometimes ambiguous: • “...statements about levels of measurement of a [variable] cannot be sensibly made in isolation from the theoretical and substantive context in which the [variable] is to be used” (Carter, 1971, p.12, quoted in Long 1997, p. 2) • e.g. education: could be measured as a: • binary variable: 1 if only attained High School or less, 0 if other. • ordinal variable: coded 6 if has PhD, 5 if has Masters, 4 if has Degree, 3 if has Highers, 2 if has Standard Grades, 1 if no qualifications • count variable: number of school years completed
Choosing the Appropriate Statistical Models: • if we choose a model that assumes a level of measurement of the dependent variable different to that of our data, then the estimates may be: • biased, • inefficient • or inappropriate • e.g. if we apply standard OLS to dependent variables that fall into any of the above categories of data, it will assume that the variable is unbounded and continuous and construct a line of best fit accordingly • In this lecture we shall only look at the logit model
1 Linear Probability Model • Q/ What happens if we try to fit a line of best fit to a regression where the dependent variable is binary? • Draw a scatter plot • draw a line of best fit • what is the main problem with the line of best fit? • How might a correct line of best fit look?
Advantage: • interpretation is straightforward: • the coefficient is interpreted in the same way as linear regression • e.g. Predicted Probability of Labour Force Participation • if b1 = 0.4, then the predicted probability of labour force participation increases by 0.4, holding all other variables constant.
Disadvantages: • heteroscedasticity: • error term will tend to be larger for middle values of x • OLS estimates are inefficient and standard errors are biased, resulting in incorrect t-statistics. • Non-normal errors: • but normality not required for OLS to be BLUE • Nonsensical Predictions: • Predicted values can be < 0, or > 1.
Functional Form: • the nonsensical predictions arise because we are trying to fit a linear function to a fundamentally non-linear relationship: • probabilities have a non-linear relationship with their determinants: • e.g. cannot say that each additional child will remove 0.4 from the probability of labour force participation: • Prob(LF particip. of 20 year old Female with no children) = 0.5 • Prob(LF particip. of 20 year old Female with 1 child) = 0.1 • Prob(LF particip. of 20 year old Female with 2 children) = -0.3
What kind of model/transformation of our data could be used to represent this kind of relationship? • I.e. one that is: • “s” shaped • coverges to zero at one end and converges to 1 at the other end • this rules out cubic transformations since they are unbounded
Note also that we may well have more than one explanatory variable, so we need a model that can transform: b0 + b1x1 + b2x2 + b3x3 into values for y that range between 0 and 1
Logistic transformation: • One popular transformaiton is the logit or logistic trasformation: • or if we have a constant term and more than more than one x:
Goodness of fit: • if observed values of y were were found for a wide range of the possible values of x, then this plot wouldn’t be a very good line of best fit • values of b0 + b1x1 + b2x2 + b3x3that are less than -4 or greater than 4 have very little effect on the probability • yet most of the values of x lie outside the -4, 4 range. • Perhaps if we alter the estimated values of bk then we might improve our line of best fit...
Estimation of the logistic model: • The above discussion leads naturally to a probability model of the form: • We now need to find a way of estimating values of bk that will best fit the data. • Unfortunately, OLS cannot be applied since the above model is non-linear in parameters.
Maximum Likelihood • The method used to estimate logit is maximum likelihood: • starts by saying, for a given set of parameter values, what is the probability of observing the current sample. • It then tries various values of the parameters to arrive at estimates of the parameters that makes the observed data most likely
Interpreting Output • Because logit regression is fundamentally non-linear, interpretation of output can be difficult • many studies that use logit overlook this fact: • either interpret magnitude of coefficients incorrectly • or only interpret signs of coefficients
---------- Variables in the Equation ------ Variable B S.E. Wald df Sig CHILDREN -.0446 .0935 .2278 1 .6331 Constant -1.0711 .1143 87.8056 1 .0000
Multivariate Logit: • More complex if have more than one x since the effect on the dependent variable will depend on the values of the other explanatory variables. • One solution to this is to use the odds: odds = P(event) = P(event) P(no event) 1 - P(event)
SPSS calculates “Exp(B)” which is the effect on the predicted odds of a unit change in the explanatory variable, holding all other variables constant: Variable B S.E. Exp(B) CHILDREN -.0446 .0935 .9564 Constant -1.0711 .1143
E.g. effect on the predicted odds of taking out MPPI of having 1 more child: • Prob(MPPI|child = 0) = 0.2552 • Odds(MPPI|child = 0) = 0.2552/(1-0.2552) = 0.3426 • Prob(MPPI|child = 1) = 0.2468 • Odds(MPPI|child = 1) = 0.2468/(1-0.2468) = 0.3277 • Proport.Change in Odds = odds after a unit change in the predictor / original odds = Exp(B) = 0.3277 / 0.3426 = 0.956
Notes: • if the value of Exp(B) is > 1 then it indicates that as the explanatory variable increases, the odds of the outcome occurring increase. • if the value of Exp(B) is < 1 then it indicates that as the explanatory variable increases, the odds of the outcome occurring decrease. • I.e. between zero and 1
Reading: Kennedy, P. “A Guide to Econometrics” chapter 15 Field, A. “Discovering Statistics”, chapter 5. For a more comprehensive treatment of this topic, you may want to consider purchasing: Scott, J. S.(1997) “Regression models for Categorical and Limited Dependent Variables”, Sage: Thousand Oaks California. This is a technical but first rate introduction to logit -- thorough but clear -- well worth purchasing if you are going to do any amount of work using logit, probit or any other qualitative response model. Probably the best book around on the subject.