Download
1 / 116
1.16k likes | 1.27k Views
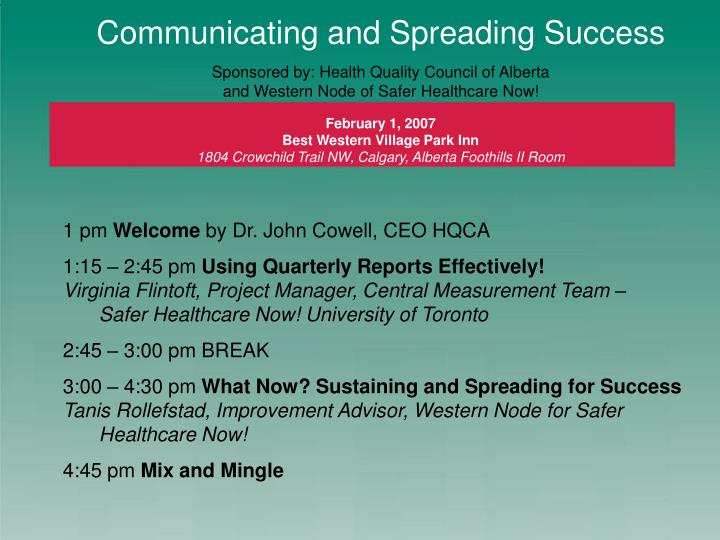
Communicating and Spreading Success Sponsored by: Health Quality Council of Alberta and Western Node of Safer Healthcare Now! February 1, 2007 Best Western Village Park Inn 1804 Crowchild Trail NW, Calgary, Alberta Foothills II Room 1 pm Welcome by Dr. John Cowell, CEO HQCA

E N D
Communicating and Spreading Success Sponsored by: Health Quality Council of Alberta and Western Node of Safer Healthcare Now! February 1, 2007 Best Western Village Park Inn 1804 Crowchild Trail NW, Calgary, Alberta Foothills II Room 1 pm Welcome by Dr. John Cowell, CEO HQCA 1:15 – 2:45 pm Using Quarterly Reports Effectively! Virginia Flintoft, Project Manager, Central Measurement Team – Safer Healthcare Now! University of Toronto 2:45 – 3:00 pm BREAK 3:00 – 4:30 pm What Now? Sustaining and Spreading for Success Tanis Rollefstad, Improvement Advisor, Western Node for Safer Healthcare Now! 4:45 pm Mix and Mingle
Put title right in here March 15, 2004 Communicating and Spreading Success John W. Cowell, MD, FRCPCChief Executive Officer February 1, 2007
HQCA has embraced and tangibly supported SHN since its inception • Our focus is on health system quality, safety and performance • We work primarily from the citizen’s point of view
We collaborate and work directly with all the health regions, professions and policy makers • Our Template is the Alberta Quality Matrix for Health • We believe effective performance management requires appropriate measurement at all levels
What’s happening in Alberta • 55 teams enrolled in Alberta • There are teams working on each of the 6 SHN interventions • Alberta leads the west in providing data to the Central Measurement Team (CMT)
What’s happening in Alberta (cont.) • Over 90% of hospitals have submitted data to CMT • Analysis of the data will reveal whether the initiatives in each of the interventions result in improved clinical outcomes • It is anticipated the analysis and conclusions of this will ensure the spread of successful change
We have no doubt those of you working hard on the interventions and collaborations are making a positive difference on the patient experience.
What can we learn from SHN’s Quarterly Reports? Virginia Flintoft, RN MSc SHN – Central Measurement Team
Objectives • Overview of the Quarterly Report format • Basic interpretation and caveats • Intervention-specific observations • Breakout + Quiz • Questions
Quarterly Report format * or preceding months pooled and reported in November
AMI – 8 CLI – 3 Med Rec – 3 RRT – 3 SSI – 7 VAP – 2 Total = 26 Quarterly Report format
Goals: • Vary for each measure • Types • Evidence based • Based on local performance • AMI 8; CLI 1; MedRec 1 & 2; • RRT 1; VAP 1 • Set by team • RRT 2 & 3 • Calculation method specified • at bottom of Raw Data Sheet Quarterly Report format
Data Analyzed & Presented: • Nationally • by Node – • Atlantic • Ontario • Quebec • Western • Paeds • by Implementation Stage – • Baseline • Early • Full Quarterly Report format
Your Job!! Quarterly Report format
Raw Data Sheet from Measurement Workbook Quarterly Report format Copy values in “Final Calculation” row on Raw Data Sheet and paste into “Local Team” row (r7) on Quarterly Report
Copy values in “Final Calculation” row on Raw Data Sheet and paste into “Local Team” row (r7) on Quarterly Report
Basic interpretation Definitions: • “N (Teams)” = Number of teams reporting data for a specific month Caveats: • When N (Teams) <5 the data is not stable due to too small a cell size • The number of teams reporting per month varies with each QR
Quarterly Report format QR #1 – data submitted April - June 2006 QR #2 – data submitted April - Sept. 2006 • Data becomes more stable as sample size increases
Basic interpretation Definitions: • “Mean” = average score for the measure for the hospitals reporting data for that month. Caveat: • The more teams reporting the more stable the mean.
Basic interpretation Definitions: • “SD” = standard deviation - summary value for how widely dispersed the scores are around the mean. In a normal distribution 95% of all scores are within 2-SDs on either side of the mean. Caveats: • Very high SD indicates large variation in scores making it difficult to use the national average to interpret your performance. • Normal curve has no defined limits - a ‘percentage’ is limited to 0 and 100. Therefore, 2-SDs above or below the mean may be >100 or <0.
To “Unhide” rows • highlight 1or 2 rows above & below node ‘section’ • right click to display menu • select “unhide”
Minimum – lowest score reported for a specific month • Maximum - highest score reported for a specific month • 25th percentile – 25% of all teams reporting data for that month have a lower score. • Median (50th percentile) – exactly half of the scores are above and below this value. • 75th Percentile - 75% of all teams reporting data for that month have a lower score. • It is better to be <25th percentile for some measures
Bracketed measures (large): • Only included in National analysis • Used for calculating confidence intervals (CI) • Bracketed measures (small): • Lower and Upper Bound = CI
Interpretation: • Compare your performance (Local Team) to National mean month-over-month • Compare your performance to CI • if score falls between upper and lower bound = statistically similar (Jan., Feb., Apr.)
No CI because 25th %ile - Max=100%
Definitions of Implementation Stages • Baseline Stage • Pre-intervention. Data collected for Baseline should be collected prior to implementing small tests of change and reflect the current process.
Definitions of Implementation Stages • Early (Partial) Implementation Stage • The team has: set a clear aim(s) for this intervention (i.e. AMI, CLI, MedRec, RRT, SSI or VAP); identified which measures will indicate if the changes will lead to improvement; and started to implement small tests of change (PDSA) to identify and refine processes, procedures and practices which will lead to improvement and achieving the aim. When the team is close to goal they are ready to move to Full Implementation.
Definitions of Implementation Stages • Full Implementation Stage • The processes, procedures and practices are finalized and have lead to significant improvement. These practices on the selected unit are being consistently applied and monitored, showing a sustained performance at or close to goal. The team has achieved their aim(s) and is ready to spread to other areas.
Interpretation: • Compare your performance (Local Team) to National monthly means– match Implementation Stage (Baseline, Early, Full) • Cut, Paste and Create an annotated Run Chart
Cut & Paste Cut & Paste Cut & Paste
Data Submission and Performance Nov.30.06
National Intervention-specific (as of Nov.’06) • AMI • ASA on arrival (AMI 1) - at or >Goal • ASA @ discharge (AMI 2) - at or >Goal • Beta Blocker @ discharge (AMI 3)- at or >Goal • ACEi/ARB @ discharge (Ami 5)- at or >Goal • Thrombolysis or Primary PCI at arrival (AMI 4a & 4b) • small cell size, ++ variation, • mean performance since May’06 (4A)40%-65% & (4B) 35%-75% • Smoking Cessation Counselling (AMI 6) • mean performance 50%-75% - is documentation adequate?
National Intervention-specific (as of Nov.’06) • AMI (cont.) • Perfect Care (AMI 7) • issues related to exclusion criteria – transfer in and out • Inpatient Mortality (AMI 8) – • poor submission (only 2 teams since Sept) • All AMI teams should submit monthly using “retrospective” form
National Intervention-specific (as of Nov.’06) • CLI, RRT & VAP - ICU collaborative measures – • CLI • data submission improved - 8-20 teams submitting data/mo. • Bloodstream infection rate /1000 days (CLI 1) • CLIs now used routinely outside ICU you may choose to expand inclusion beyond ICU • Insertion Bundle (CLI 2) • National mean performance 50% • Early & Full Implementation 45%-80% • Maintenance Bundle (CLI 3) • Early & Full Implementation ~70%
National Intervention-specific (as of Nov.’06) • CLI, RRT & VAP (cont.) • RRT • data submission improved - 11-19 teams submitting data/mo • Percent of codes outside of ICU (RRT 2) – 70%-90% + high SD • Utilization Rapid Response Team (RRT 3) – 1-200 + high SD • VAP • better submission Nationally (21-41 teams/month) • VAP Bundle compliance (VAP 2) between 57-83% - goal=95% • Be sure your teams are applying revised definition (CDC)
National Intervention-specific (as of Nov.’06) • Medication Reconciliation • Excellent rates of submission – 27 to 69 teams/mo. • Intentional Undocumented Discrepancies (MedRec 1) • Median from 0.6 down to 0.26 • Unintentional Discrepancies (MedRec 2) • Median ranges from 0.57 to 1.00 • Likely due to CCHSA requirement and Western Collaborative
National Intervention-specific (as of Nov.’06) • Surgical Site Infection • Excellent rates of submission likely due to Western Collaboration • Timely Prophylactic Antibiotic (SSI 1) • Appropriate prophylactic antibiotic (SSI 2) • Appropriate Hair Removal (SSI 4) • Appropriate selection of prophylactic antibiotic (SSI 7) • Glucose control for Major Cardiac (SSI 5) – 3 to 5 sites / month • Glucose control applicable beyond Major Cardiac – IMH • Normothermia (SSI 6) – 60% to 70%
National Intervention-specific (as of Nov.’06) • Surgical Site Infection (cont.) • Strong move to full implementation • Percent Clean Surg w/ Surgical Infection (SSI 3) • Low submission rate likely due to difficulty monitoring SSI • Appropriate selection of Prophylactic antibiotics (SSI-7) – to be revised by SSI faculty
Sharing the Quarterly Reports • With who do you (KOCs + Team Leaders) share the QR info? • Team, Sr. Mgmt, Board • What should you tell each group?
Breakout Groups • Complete the quiz together • Determine the message(s) for your assigned group (i.e. Team, Sr. Mgmt, Board) • Report back
Questions? Thank you for your interest in SHN! Contact Information: Name Virginia Flintoft Address University of Toronto Phone/email 416-946-8350 virginia.flintoft@utoronto.ca
Sustaining and Spreading for Success T. Rollefstad SIA Western Node February 1 & 2, 2007 Safer Healthcare Now! Western Node