Download
1 / 22
220 likes | 349 Views
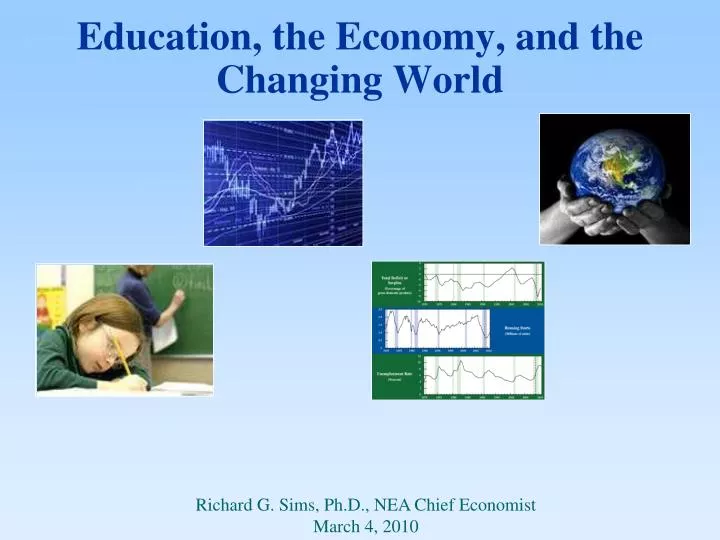
Education, the Economy, and the Changing World. Richard G. Sims, Ph.D., NEA Chief Economist March 4, 2010. The economic number for today is:. DJI passes 10, 000 —highest level in 12 months Unemployment rate passes 10 % —highest level since 1983

E N D
Education, the Economy, and the Changing World Richard G. Sims, Ph.D., NEA Chief Economist March 4, 2010
The economic number for today is: • DJI passes 10,000—highest level in 12 months • Unemployment rate passes 10%—highest level since 1983 • Number of people employed—below the number 10 years ago. • Unemployment due to the recession—likely to last 10 years.
All of the job gains since 1999 have been lost In spite of adding 3.5 million people to the population since 2009 Six million plus jobs have been lost Job losses continued for two years after end of the last recession Source: Employment data from Bureau of Labor Statistics; Recession dating from National Bureau of Economic Research.
The long road back to Normal If the bottom is now (December 2009) and the recovery rate is the average rate of the previous recessions, we well get back to the pre-recession employment level in December 2016. • 2008 • 2009 • 2010 • 2011 • 2012 • 2013 • 2014 • 2015 • 2016 Source: Employment data from Bureau of Labor Statistics; Recession recovery information from “This Time is Different,” by Carmen Reinhart and Kenneth Rogoff, Princeton University Press, 2009.
The even longer road back to Normal If the bottom is now (December 2009) and the recovery rate is the average rate of the previous FINANCIAL RECESSIONS, the recovery rate is only around half as fast. • 2008 • 2009 • 2010 • 2011 • 2012 • 2013 • 2014 • 2015 • 2016 Source: Employment data from Bureau of Labor Statistics; Recession recovery information from “This Time is Different,” by Carmen Reinhart and Kenneth Rogoff, Princeton University Press, 2009.
…And still further? Unfortunately, unemployment levels have not reached bottom, and probably won’t until mid-2010 or later. And a “W”-shaped recession cannot be ruled out. • 2008 • 2009 • 2010 • 2011 • 2012 • 2013 • 2014 • 2015 • 2016 Source: Employment data from Bureau of Labor Statistics; Recession recovery information from “This Time is Different,” by Carmen Reinhart and Kenneth Rogoff, Princeton University Press, 2009.
…or maybe even a half recovery? Growth stalls before lost jobs are fully replaced. This scenario could occur if, for example: consumers lose confidence in future growth, credit becomes more difficult or interest rates rise sharply, energy prices spike, or the dollar exchange rate falls • 2008 • 2009 • 2010 • 2011 • 2012 • 2013 • 2014 • 2015 • 2016 A half-recovery Source: Employment data from Bureau of Labor Statistics; Recession recovery information from “This Time is Different,” by Carmen Reinhart and Kenneth Rogoff, Princeton University Press, 2009.
Projection of public revenues lost due to jobless since the start of the recession Source: Employment data from BLS and employment growth projections from previous charts; The assumed monthly job growth beginning January of 2010 is 94,000; The estimate for tax revenue is$21 billion per million employed workers and is based on U.S. tax data reported by the OECD and calibrated by the author to reflect employment income. The lost income is assumed to grow at 3% for 2010 and in subsequent years.
The recession will have permanent affects on the economy GDP per capita In every future year the output of the economy will be less because of the output lost in the recession Long-term trend Years
A similar permanent downward shift applies to any cuts in education funding Funding per pupil Any education funding cuts represent a permanent reduction in education investment—lowering future earnings, productivity, competitiveness, etc. Long-term trend for education funding Years
And there is no guarantee that funding will return to its long-term growth trend And if property tax or other revenue limitations constrain the annual rate of revenue growth, per pupil investment will grow even more slowly Funding per pupil Long-term trend for education funding Years
We have almost matched our all time high in income concentrated at the top 23.9% 23.5% Inequality has risen sharply Does rising inequality matter for economic growth? Source: Thomas Piketty and Emmanual Saez, based on IRS data.
Growth in family income over the last half-centuryThose were the days, my friend,(we thought they would never end) Growth “Then” (’47-’73) Growth “Now” (’73-’05)
Will high debt and deficits be deadly for the future? It may not be pretty— but we have lived through it before
And finally: Guess who is not going to be buying a house anytime over the next seven years?(Hint: a foreclosure does not help your credit score) 1 of 4 is currently “underwater” Source: CalculatedRisk.com, based on delinquent and foreclosure data from the Mortgage Bankers Association.
Some characteristics of the post-stimulus economy and beyond • States and local governments in perpetual crisis and in need of substantial restructuring • The employment growth at below historic averages • Wages and personal income growing more slowly • Consumer spending, currently stalled, will grow at lower rates in the future • Housing is unlikely to re-gain its “investment grade” status (Thank goodness!) • Business investment is presently at extremely low levels and will only come back gradually and cautiously. Longer term, there will be ever increasing pressure for efficiency and for substituting capital for labor. • Taxes at all levels are likely to rise
State and Local Operating Balance Measure, as a Percentage of Gross Domestic Product Notes: The operating balance is a measure of the sector’s ability to cover its current expenditures out of current receipts. Simulations are based on current policy.