Download
1 / 16
160 likes | 479 Views
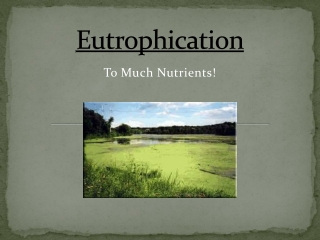
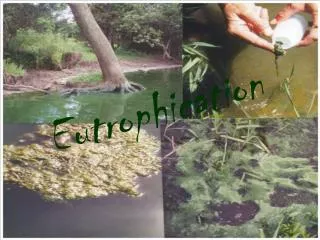
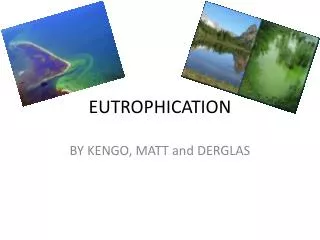
Eutrophication. Eutrophication. When it occurs naturally Bodies of water gradually age and become more productive. Takes thousands of years to develop. Today Overabundance of nutrients and wastes has increased this process at an alarming rate. Today’s Eutrophication.

E N D
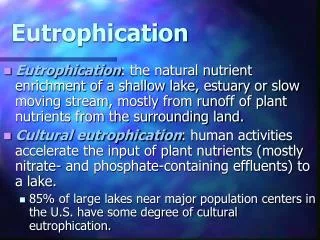
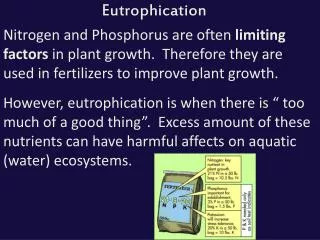
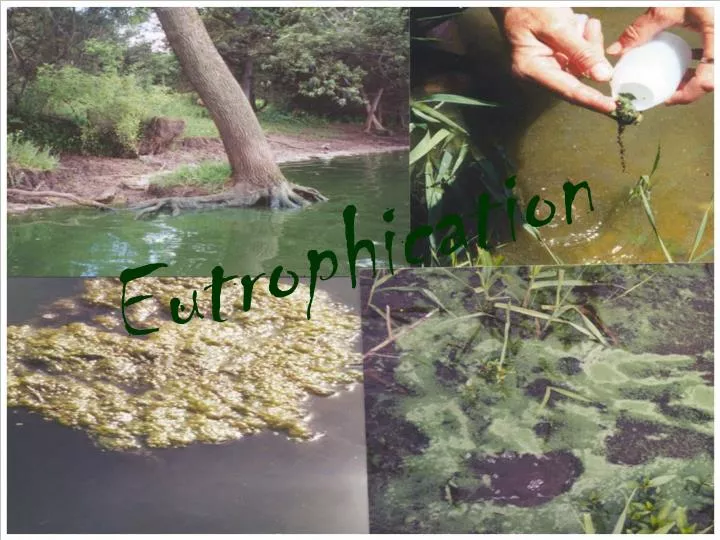
Eutrophication • When it occurs naturally • Bodies of water gradually age and become more productive. • Takes thousands of years to develop. • Today • Overabundance of nutrients and wastes has increased this process at an alarming rate.
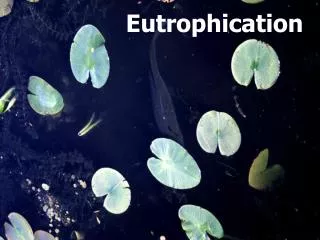
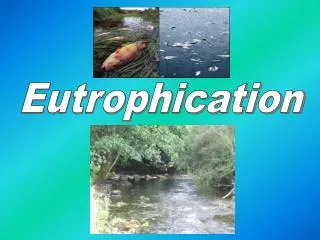
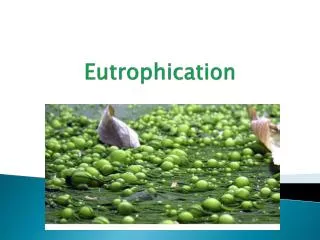
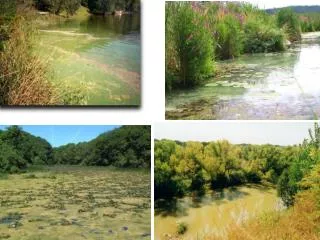
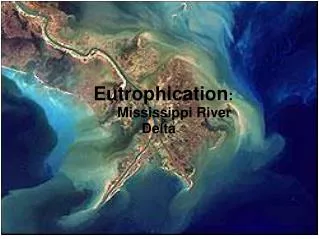
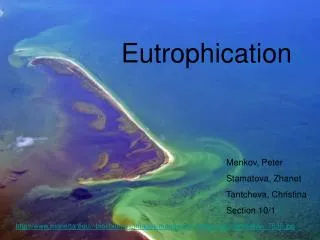
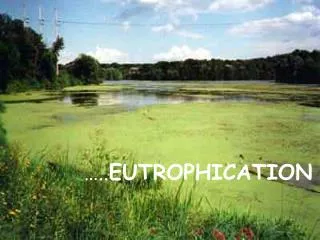
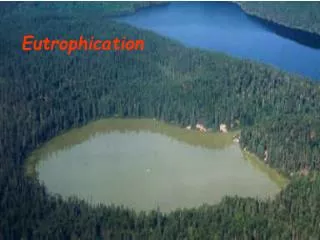
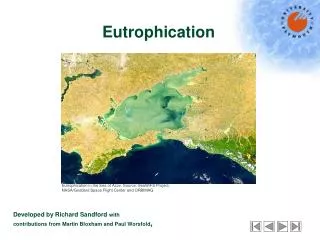
Today’s Eutrophication • A condition in which an aquatic ecosystem contains a high nutrient concentration (mainly phosphorus, nitrogen and carbon nutrients), which stimulates blooms of algae to occur. • Overgrowth of algae blocks sunlight to reach aquatic plant species below this “carpet” of algae and die off. • Bacteria feed on dead matter and increase in number • This in turn causes oxygen depletion, and other aquatic species may be choked out (fish kills)
How ? • Humans add excessive amounts of plant nutrients to streams and lakes in various ways. • Runoff from agricultural fields, field lots, urban lawns, and golf courses are a source for these nutrients. • Untreated, or partially-treated, domestic sewage is another major source.
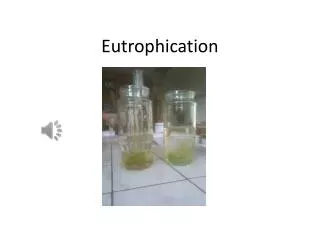
Eutrophication Project Set up
Eutrophication Project • Our objectives: • To observe and compare the effect of different concentrations of fertilizer runoff on aquatic environments. • The above objective will be achieved by designing an experiment that will enable us to manipulate the quality of water from different aquatic environments • These changes in water quality will be measured at regular intervals and analyzed • Analysis of this data will allow us to discuss the significance of any negative impacts on water quality and how these relate to the observed prevalence of eutrophic aquatic systems
Formatting Guidelines • Times New Roman (12) • Single spaced • No cover page • Top left-hand side • Title (must be specific and appropriate) • Name • Course and section (Biol 1210 – X) • TA’s name • Date • Five sections • Introduction, Methods, Results, Discussion, and References
Formatting….. • Each section must be labeled, left-justified, labeled, bold, and italicized • First sentence of each paragraph should be left-indented • Paragraphs must be well-developed and no less than 5 sentences in length • Be aware of sentence structure and grammar • ROL sentences • Writing center
Introduction • Start with the big picture • Background on eutrophication • Case studies (3 peer-reviewed articles at a minimum) • In-text citations • Single authors, 2 authors, multiple authors • Objectives • Hypothesis • Predictions
Methods • Experimental design • Protocol • Weekly fertilizer added • Weekly measurements taken • Water quality measurements and timeline • Weekly: dissolved oxygen, conductivity, pH, optical density • Pre and post-treatment: nutrient levels • Instruments used (name and brand) • Water quality data: dissolved oxygen meter, conductivity meter, pH meter, spectrophotometer • Water nutrient data: nitrate, nitrite, and phosphorus test kits
Terrestrial (Farm) Bean plant (Vicia faba) 2 seeds 4 pots per treatment Fertilizer (liquid) Brand: Fertilizer treatment: Control (no fertilizer) Low (25%) High (100%) Potting Soil Standard commercial mix Lighting 16L:8D photoperiod Aquatic (Pond) Three aquaria and 3 treatments: Fertilizer runoff from potted pants Control (no fertilizer) Low (25%) High (100%) Algae (Oedogonium sp.) Grated aquarium covers to allow fertilizer runoff in each tank Access holes to retrieve water samples and conduct water quality measurements Experimental Design
Results • Four graphs at a minimum • Line graphs • Measurements over time (i.e. DO, conductivity, pH, optical density) • Graph all treatments • Bar graphs • When comparing averages (i.e. water nutrient levels) • Graph all treatments • Figure legends • Units • Axes labels
Graphing Fig 2. Dissolved oxygen levels from aquaria treated with 3 different fertilizer concentrations. Oxygen levels in the aquarium treated with the highest fertilizer concentration shows a steady increase…… Fig 1. Nitrate levels from aquaria treated with 3 different fertilizer concentrations. Final nitrate levels show a high increase…….
Discussion • Meaning of results • Restate the purpose of the study • Was your hypothesis supported or refuted? • How is it related to previous research? • Case studies (3 peer-reviewed articles at a minimum) • How would you improve the experiment? • Importance of your findings
References • See eutrophication experiment report instructions
Next Lab • Quiz # 5 • Soil Quality and Food Webs and Trophic Levels • Introduced Species and Biological Controls Power Point Presentations • Eutrophication Report due on April 16th • Final Exam April 23rd • Multiple choice (100 points)