Download
1 / 11
110 likes | 128 Views
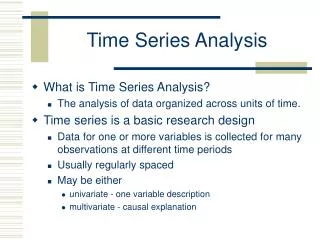
Explore the concept of time series data and its application in measuring various systems. Learn to analyze scalar, vector, and matrix time series data and understand the qualities like sine waves, noise, probability density functions, and auto-correlation functions.

E N D
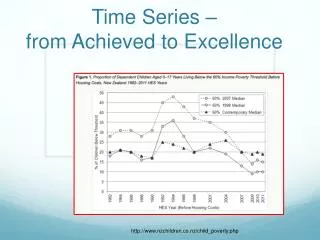
Def.: Time Series Time series is a collection or sequence of numbers that represent the state of any system as a function of time or space or any other “ordering” independent variable.
Scalar Time Series Data e.g., Sealevel Pressure (almost periodic) e.g., Bottom Temperature (transient)
Vector Time Series Data Ocean Currents Speed (length of “stick”) and direction (orientation of “stick”) as a function of time
Matrix Time Series Data Spatial pattern of “some scalar” Reflectance at 645 nm (red part of visible spectrum) of ice, water, and land from MODIS July-26, 2009 11:40 UTC
Matrix Time Series Data Spatial patterns that vary with time
MEASUREMENT=SIGNAL+NOISE How to separate?
Ensembles are a set of realizations xi(t) of a random process {x(t)} x1(t) Experiment-1 tree-1, drifter-1 x2(t) Experiment-2 tree-2, drifter-2 x3(t) Experiment-3 tree-3, drifter-3 x4(t) Experiment-4 tree-4, drifter-4 t t+τ Time t and lag τ
Qualities of time series: Sine wave Sine wave plus random noise Narrow-band random noise Wide-band random noise
Probability Density Functions: (histograms) Sine wave Sine wave plus random noise Narrow-band random noise Wide-band random noise
Auto-correlation functions Sine wave Sine wave plus random noise Lagged Auto-Correlation Rxx() Narrow-band random noise Wide-band random noise 0 Lag Time
Auto-spectral Density Sine wave Sine wave plus random noise Narrow-band random noise Wide-band random noise