Download
1 / 14
150 likes | 266 Views
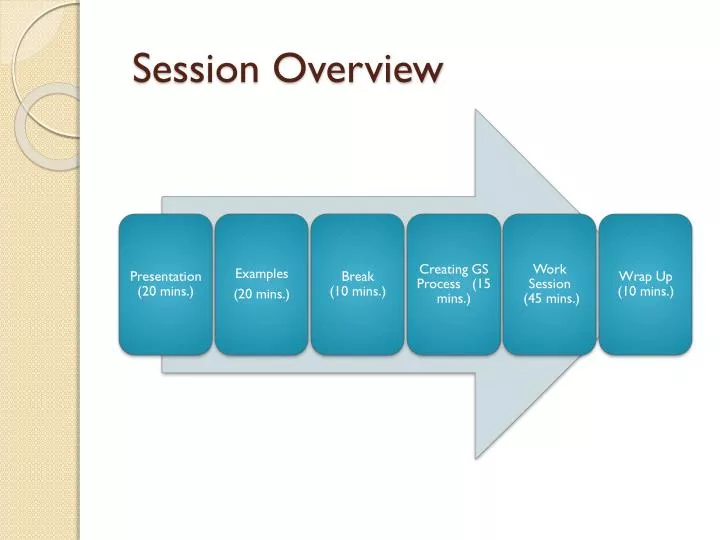
Session Overview. W hat does a syllabus do?. Contract between learner and instructor Communicate expectations Explain grading system Clarify policies Provide lots of useful information And more …. Syllabus Challenges. Text density Too long Connection to course not transparent

E N D
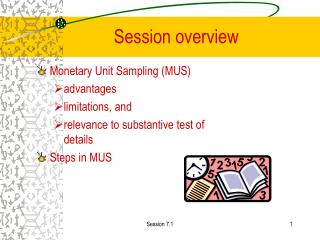
What does a syllabus do? • Contract between learner and instructor • Communicate expectations • Explain grading system • Clarify policies • Provide lots of useful information • And more …
Syllabus Challenges • Text density • Too long • Connection to course not transparent • Not answer student ??s • And ??? Students don’t read them!
Graphic Syllabus (GS) • A visual representation of the course topics showing how they’re organized and connected. • Supplement • Pluses for students& instructor • Research basis • QM Standard I • Course Overview & Introduction • 1.2 Students are introduced to the purpose and structure of the course.
Driving Directions and a Course Roadmap! You are here! You are here! You are here! The Best of Both!
Novice Expert Sharing Your Understanding
Value Add for Instructor • Better course organization • Increases focus on important ideas • Decreases emphasis on content coverage • Increases alignment of course components • Allows creativity & personal touch Better course design!
GS Overview • No, one right way or format! • Different formats • Topic map • Mindmap • Flow Chart • Process Model • Original Map • Graphic credit: Lisa Leifeste
References • Clark, J. M. & Paivio, A. (1991). Dual coding theory and education. Educational Psychology Review, 3(3), 149-170. • Fleming, N.D. & Mills, C. (1992). Helping Students Understand How They Learn. The Teaching Professor, Vol. 7 No. 4, Magma Publications, Madison, Wisconsin, USA. • Paivio, A. (1983). The empirical case for dual coding. In J. Yuille (Ed.), Imagery, memory and cognition. Hillsdale, N. J.: Lawrence Erlbaum • Rollins, D., Purifoy, S. & Crook, R. (2010). Put your brain on paper? The graphic syllabus --an element of “transparent course design” [PowerPoint slides]. Retrieved from http:// cte.lsua.edu/.../STI_10-Reed_Crook_Sandra_Purifoy_Debra_Rollins-... • Smith, R. (2010). How do I easilycreate a graphicsyllabus? University of ArkansasforMedicalSciences Office of Educational Development elearning. Podcastretrievedfromhttp://vimeo.com/14586911 • Vekiri, I. (2002). Whatis thevalue of graphicaldisplays in learning?EducationalPsychology Review,14(3), 261-312. • Smith, R. (2010, Oct. 21). Thegraphicsyllabus as a coursedesigntool. Jossey-Basss online teachingandlearningconference online. Retrievedfrom http://2010.onlineteachingandlearning.com/program/#day2 • Winn, W. (1991). Learning from maps and diagrams. EducationalPsychologyReview, 3(13), 211-247.
Connections Connections Connections Connections
Let’s look at some GS examples! Fostering Online Learning Community Phases of Engagement Phase 1: Co-exist Phase 2: Communicate Phase 3: Cooperate Weeks 6-8 Develop Syllabus Weeks 1 & 2 Getting Started Weeks 3 – 5 Group Work Collaborators Newcomers Cooperators