Download

1 / 32
320 likes | 331 Views
United States environmental testing market was valued USD 2411.75 Million in 2019 and is forecast to grow at CAGR of 7.06% in next five years to reach USD 3209.60 Million by 2025

E N D
2016 – 2026F GLOBAL AIR CONDITIONERS MARKET FORECAST & OPPORTUNITIES www.techsciresearch.com MARKET INTELLIGENCE . CONSULTING
Table of Contents S. No. Contents 1. Product Overview 2. Research Methodology 3. Executive Summary 4. Voice of Customer 4.1. Brand Awareness 4.2. Factors Influencing Purchase Decision 4.3. Brand Satisfaction 4.4. Challenges Faced Post Purchase 5. Global Air Conditioners Market Outlook, 2016-2026F 5.1. Market Size & Forecast 5.1.1. By Value & Volume 5.2. Market Share & Forecast By Product Type (Chillers, VRFs, Ductable Splits, Light Commercial Air Conditioners and Others) 5.2.1. Light Commercial Air Conditioners Market Share - By Product Type (High Wall Splits, Window Air Conditioners, Cassettes and Concealed Ductable Splits) 5.2.1.1. 5.2.2. By Region 5.2.3. By Company (2020) 5.3. Market Map (By Product Type, By Region) 2 © TechSci Research
Table of Contents S. No. Contents 6. Asia-Pacific Air Conditioners Market Outlook, 2016-2026F 6.1. Market Size & Forecast 6.1.1. By Value & Volume 6.2. Market Share & Forecast 6.2.1. By Product Type 6.2.1.1. Light Commercial Air Conditioners Market Share - By Product Type 6.2.2. By Country 6.2.2.1. China Air Conditioners Market Outlook, 2016-2026F 6.2.2.1.1. Market Size & Forecast 6.2.2.1.1.1. By Value & Volume 6.2.2.1.2. Market Share & Forecast 6.2.2.1.2.1. By Product Type 6.2.2.1.2.2. By End Use Sector 6.2.2.2. Japan Air Conditioners Market Outlook, 2016-2026F 6.2.2.2.1. Market Size & Forecast 6.2.2.2.1.1. By Value & Volume 6.2.2.2.2. Market Share & Forecast 6.2.2.2.2.1. By Product Type 6.2.2.2.2.2. By End Use Sector 3 © TechSci Research
Table of Contents S. No. Contents 6.2.2.3. India Air Conditioners Market Outlook, 2016-2026F 6.2.2.3.1. Market Size & Forecast 6.2.2.3.1.1. By Value & Volume 6.2.2.3.2. Market Share & Forecast 6.2.2.3.2.1. By Product Type 6.2.2.3.2.2. By End Use Sector 6.2.2.4. Indonesia Air Conditioners Market Outlook, 2016-2026F 6.2.2.4.1. Market Size & Forecast 6.2.2.4.1.1. By Value & Volume 6.2.2.4.2. Market Share & Forecast 6.2.2.4.2.1. By Product Type 6.2.2.4.2.2. By End Use Sector 6.2.2.5. Vietnam Air Conditioners Market Outlook, 2016-2026F 6.2.2.5.1. Market Size & Forecast 6.2.2.5.1.1. By Value & Volume 6.2.2.5.2. Market Share & Forecast 6.2.2.5.2.1. By Product Type 6.2.2.5.2.2. By End Use Sector 4 © TechSci Research
Table of Contents S. No. Contents 7. North America Air Conditioners Market Outlook, 2016-2026F 7.1. Market Size & Forecast 7.1.1. By Value & Volume 7.2. Market Share & Forecast 7.2.1. By Product Type 7.2.1.1. Light Commercial Air Conditioners Market Share - By Product Type 7.2.2. By Country 7.2.2.1. United States Air Conditioners Market Outlook, 2016-2026F 7.2.2.1.1. Market Size & Forecast 7.2.2.1.1.1. By Value & Volume 7.2.2.1.2. Market Share & Forecast 7.2.2.1.2.1. By Product Type 7.2.2.1.2.2. By End Use Sector 7.2.2.2. Canada Air Conditioners Market Outlook, 2016-2026F 7.2.2.2.1. Market Size & Forecast 7.2.2.2.1.1. By Value & Volume 7.2.2.2.2. Market Share & Forecast 7.2.2.2.2.1. By Product Type 7.2.2.2.2.2. By End Use Sector 5 © TechSci Research
Table of Contents S. No. Contents 7.2.2.3. Mexico Air Conditioners Market Outlook, 2016-2026F 7.2.2.3.1. Market Size & Forecast 7.2.2.3.1.1. By Value & Volume 7.2.2.3.2. Market Share & Forecast 7.2.2.3.2.1. By Product Type 7.2.2.3.2.2. By End Use Sector 8. Europe Air Conditioners Market Outlook, 2016-2026F 8.1. Market Size & Forecast 8.1.1. By Value & Volume 8.2. Market Share & Forecast 8.2.1. By Product Type 8.2.1.1. Light Commercial Air Conditioners Market Share - By Product Type 8.2.2. By Country 8.2.2.1. Russia Air Conditioners Market Outlook, 2016-2026F 8.2.2.1.1. Market Size & Forecast 8.2.2.1.1.1. By Value & Volume 8.2.2.1.2. Market Share & Forecast 8.2.2.1.2.1. By Product Type 8.2.2.1.2.2. By End Use Sector 6 © TechSci Research
Table of Contents S. No. Contents 8.2.2.2. Italy Air Conditioners Market Outlook, 2016-2026F 8.2.2.2.1. Market Size & Forecast 8.2.2.2.1.1. By Value & Volume 8.2.2.2.2. Market Share & Forecast 8.2.2.2.2.1. By Product Type 8.2.2.2.2.2. By End Use Sector 8.2.2.3. France Air Conditioners Market Outlook, 2016-2026F 8.2.2.3.1. Market Size & Forecast 8.2.2.3.1.1. By Value & Volume 8.2.2.3.2. Market Share & Forecast 8.2.2.3.2.1. By Product Type 8.2.2.3.2.2. By End Use Sector 8.2.2.4. Spain Air Conditioners Market Outlook, 2016-2026F 8.2.2.4.1. Market Size & Forecast 8.2.2.4.1.1. By Value & Volume 8.2.2.4.2. Market Share & Forecast 8.2.2.4.2.1. By Product Type 8.2.2.4.2.2. By End Use Sector 7 © TechSci Research
Table of Contents S. No. Contents 8.2.2.5. United Kingdom Air Conditioners Market Outlook, 2016-2026F 8.2.2.5.1. Market Size & Forecast 8.2.2.5.1.1. By Value & Volume 8.2.2.5.2. Market Share & Forecast 8.2.2.5.2.1. By Product Type 8.2.2.5.2.2. By End Use Sector 9. Middle East & Africa Air Conditioners Market Outlook, 2016-2026F 9.1. Market Size & Forecast 9.1.1. By Value & Volume 9.2. Market Share & Forecast 9.2.1. By Product Type 9.2.1.1. Light Commercial Air Conditioners Market Share - By Product Type 9.2.2. By Country 9.2.2.1. Saudi Arabia Air Conditioners Market Outlook, 2016-2026F 9.2.2.1.1. Market Size & Forecast 9.2.2.1.1.1. By Value & Volume 9.2.2.1.2. Market Share & Forecast 9.2.2.1.2.1. By Product Type 9.2.2.1.2.2. By End Use Sector 8 © TechSci Research
Table of Contents S. No. Contents 9.2.2.2. Egypt Air Conditioners Market Outlook, 2016-2026F 9.2.2.2.1. Market Size & Forecast 9.2.2.2.1.1. By Value & Volume 9.2.2.2.2. Market Share & Forecast 9.2.2.2.2.1. By Product Type 9.2.2.2.2.2. By End Use Sector 9.2.2.3. UAE Air Conditioners Market Outlook, 2016-2026F 9.2.2.3.1 Market Size & Forecast 9.2.2.3.1.1. By Value & Volume 9.2.2.3.2. Market Share & Forecast 9.2.2.3.2.1. By Product Type 9.2.2.3.2.2. By End Use Sector 9.2.2.4. Turkey Air Conditioners Market Outlook, 2016-2026F 9.2.2.4.1 Market Size & Forecast 9.2.2.4.1.1. By Value & Volume 9.2.2.4.2. Market Share & Forecast 9.2.2.4.2.1. By Product Type 9.2.2.4.2.2. By End Use Sector 9 © TechSci Research
Table of Contents S. No. Contents 10. South America Air Conditioners Market Outlook, 2016-2026F 10.1. Market Size & Forecast 10.1.1. By Value & Volume 10.2. Market Share & Forecast 10.2.1. By Product Type 10.2.1.1. Light Commercial Air Conditioners Market Share - By Product Type 10.2.2. By Country 10.2.2.1. Brazil Air Conditioners Market Outlook, 2016-2026F Market Size & Forecast 10.2.2.1.1. 10.2.2.1.1.1. By Value & Volume Market Share & Forecast 10.2.2.1.2. 10.2.2.1.2.1. By Product Type 10.2.2.1.2.2. By End Use Sector 10.2.2.2. Argentina Air Conditioners Market Outlook, 2016-2026F Market Size & Forecast 10.2.2.2.1. 10.2.2.2.1.1. By Value & Volume Market Share & Forecast 10.2.2.2.2. 10.2.2.2.2.1. By Product Type 10.2.2.2.2.2. By End Use Sector 10 © TechSci Research
Table of Contents S. No. Contents 10.2.2.3. Colombia Air Conditioners Market Outlook, 2016-2026F 10.2.2.3.1. Market Size & Forecast 10.2.2.3.1.1. By Value & Volume 10.2.2.3.2. Market Share & Forecast 10.2.2.3.2.1. By Product Type 10.2.2.3.2.1. By End Use Sector 11. Market Dynamics 11.1. Drivers 11.2. Challenges 12. Impact of COVID-19 on Global Air Conditioners Market 13. Market Trends & Developments 14. Competitive Landscape 14.1. Competition Outlook 14.2. Company Profiles (Top 10 Leading Companies) 14.2.1. Daikin Industries, Ltd. 14.2.2. Gree Electric Appliances Inc. 14.2.3. Carrier Global Corporation 14.2.4. Midea Group Co., Ltd. 14.2.5. Samsung Electronics Co. Ltd. 11 © TechSci Research
Table of Contents S. No. Contents 14.2.6. Panasonic Corporation 14.2.7. Mitsubishi Electric Corporation 14.2.8. Johnson Controls-Hitachi Air Conditioning Limited 14.2.9. Toshiba Corporation 14.2.10. Trane Technologies plc 15. Strategic Recommendations 16. About Us & Disclaimer 12 © TechSci Research
List of Figures Figure No. Title Figure 1: Global Air Conditioners Market Size, By Value (USD Billion), By Volume (Million Units), 2016-2026F Figure 2: Global Population (Million), 2015-2019 Figure 3: Global Air Conditioners Market Share, By Product Type, By Value, 2016-2026F Figure 4: Global Air Conditioners Market Share, By Product Type, By Volume, 2016-2026F Figure 5: Global Light Commercial Air Conditioners Market Share, By Product Type, By Value, 2016-2026F Figure 6: Global Air Conditioners Market Share, By Region, By Value, 2020 & 2026F Figure 7: Global Air Conditioners Market Share, By Company, By Value, 2020 Global Air Conditioners Market Map, By Product Type, Market Size (USD Billion) & Growth Rate (%), 2020 Global Air Conditioners Market Map, By Region, Market Size (USD Billion) & Growth Rate (%), 2020 Figure 8: Figure 9: Asia-Pacific Air Conditioners Market Size, By Value (USD Billion), By Volume (Million Units), 2016- Figure 10: 2026F Figure 11: Asia-Pacific Country-wise Population (Million) for the year 2019 Figure 12: Asia-Pacific Air Conditioners Market Share, By Product Type, By Value, 2016-2026F Figure 13: Asia-Pacific Air Conditioners Market Share, By Product Type, By Volume, 2016-2026F Asia-Pacific Light Commercial Air Conditioners Market Share, By Product Type, By Value, 2016- Figure 14: 2026F Asia-Pacific Air Conditioners Market Share, By Country, By Value, 2016-2026F Figure 15: Figure 16: China Air Conditioners Market Size, By Value (USD Million), By Volume (Million Units), 2016-2026F Figure 17: China Population, 2015-2019 (Million) Figure 18: China Air Conditioners Market Share, By Product Type, By Value, 2020 & 2026F Figure 19: China Light Commercial Air Conditioners Market Share, By Product Type, By Value, 2020 & 2026F Figure 20: China Air Conditioners Market Share, By End Use Sector, By Value, 2020 & 2026F 13 © TechSci Research
List of Figures Figure No. Title China Air Conditioners Commercial End Use Market Share, By End Use Sector, By Value, 2020 & 2026F Figure 21: Figure 22: Japan Air Conditioners Market Size, By Value (USD Million), By Volume (Million Units), 2016-2026F Figure 23: Japan Population, 2015-2019 (Million) Figure 24: Japan Air Conditioners Market Share, By Product Type, By Value, 2020 & 2026F Figure 25: Japan Light Commercial Air Conditioners Market Share, By Product Type, By Value, 2020 & 2026F Figure 26: Japan Air Conditioners Market Share, By End Use Sector, By Value, 2020 & 2026F Japan Air Conditioners Commercial End Use Market Share, By End Use Sector, By Value, 2020 & 2026F Figure 27: Figure 28: India Air Conditioners Market Size, By Value (USD Million), By Volume (Million Units), 2016-2026F Figure 29: India Population, 2015-2019 (Million) Figure 30: India Air Conditioners Market Share, By Product Type, By Value, 2020 & 2026F Figure 31: India Light Commercial Air Conditioners Market Share, By Product Type, By Value, 2020 & 2026F Figure 32: India Air Conditioners Market Share, By End Use Sector, By Value, 2020 & 2026F India Air Conditioners Commercial End Use Market Share, By End Use Sector, By Value, 2020 & Figure 33: 2026F Indonesia Air Conditioners Market Size, By Value (USD Million), By Volume (Million Units), 2016- 2026F Figure 34: Figure 35: Indonesia Population, 2015-2019 (Million) Figure 36: Indonesia Air Conditioners Market Share, By Product Type, By Value, 2020 & 2026F Indonesia Light Commercial Air Conditioners Market Share, By Product Type, By Value, 2020 & Figure 37: 2026F Figure 38: Indonesia Air Conditioners Market Share, By End Use Sector, By Value, 2020 & 2026F 14 © TechSci Research
List of Figures Figure No. Title Indonesia Air Conditioners Commercial End Use Market Share, By End Use Sector, By Value, 2020 Figure 39: & 2026F Vietnam Air Conditioners Market Size, By Value (USD Million), By Volume (Million Units), 2016- 2026F Figure 40: Figure 41: Vietnam Population, 2015-2019 (Million) Figure 42: Vietnam Air Conditioners Market Share, By Product Type, By Value, 2020 & 2026F Vietnam Light Commercial Air Conditioners Market Share, By Product Type, By Value, 2020 & 2026F Figure 43: Figure 44: Vietnam Air Conditioners Market Share, By End Use Sector, By Value, 2020 & 2026F Vietnam Air Conditioners Commercial End Use Market Share, By End Use Sector, By Value, 2020 & 2026F North America Air Conditioners Market Size, By Value (USD Billion), By Volume (Million Units), 2016-2026F Figure 45: Figure 46: Figure 47: North America Population (Million), By Country, 2016-2019 Figure 48: North America Air Conditioners Market Share, By Product Type, By Value, 2016-2026F Figure 49: North America Air Conditioners Market Share, By Product Type, By Volume, 2016-2026F North America Light Commercial Air Conditioners Market Share, By Product Type, By Value, 2016- Figure 50: 2026F Figure 51: North America Air Conditioners Market Share, By Country, By Value, 2016-2026F United States Air Conditioners Market Size, By Value (USD Million), By Volume (Million Units), Figure 52: 2016-2026F Figure 53: United States Population, 2015-2019 (Million) Figure 54: United States Air Conditioners Market Share, By Product Type, By Value, 2020 & 2026F United States Light Commercial Air Conditioners Market Share, By Product Type, By Value, 2020 & Figure 55: 2026F 15 © TechSci Research
List of Figures Figure No. Title Figure 56: United States Air Conditioners Market Share, By End Use Sector, By Value, 2020 & 2026F United States Air Conditioners Commercial End Use Market Share, By End Use Sector, By Value, 2020 & 2026F Canada Air Conditioners Market Size, By Value (USD Million), By Volume (Million Units), 2016- 2026F Figure 57: Figure 58: Figure 59: Canada Population, 2015-2019 (Million) Figure 60: Canada Air Conditioners Market Share, By Product Type, By Value, 2020 & 2026F Figure 61: Canada Light Commercial Air Conditioners Market Share, By Product Type, By Value, 2020 & 2026F Figure 62: Canada Air Conditioners Market Share, By End Use Sector, By Value, 2020 & 2026F Canada Air Conditioners Commercial End Use Market Share, By End Use Sector, By Value, 2020 & 2026F Figure 63: Figure 64: Mexico Air Conditioners Market Size, By Value (USD Million), By Volume (Million Units), 2016-2026F Figure 65: Mexico Population, 2015-2019 (Million) Figure 66: Mexico Air Conditioners Market Share, By Product Type, By Value, 2020 & 2026F Figure 67: Mexico Light Commercial Air Conditioners Market Share, By Product Type, By Value, 2020 & 2026F Figure 68: Mexico Air Conditioners Market Share, By End Use Sector, By Value, 2020 & 2026F Mexico Air Conditioners Commercial End Use Market Share, By End Use Sector, By Value, 2020 & Figure 69: 2026F Figure 70: Europe Air Conditioners Market Size, By Value (USD Billion), By Volume (Million Units), 2016-2026F Figure 71: Europe Population (Million), 2015-2019 Figure 72: Europe Air Conditioners Market Share, By Product Type, By Value, 2016-2026F Figure 73: Europe Air Conditioners Market Share, By Product Type, By Volume, 2016-2026F Figure 74: Europe Light Commercial Air Conditioners Market Share, By Product Type, By Value, 2016-2026F 16 © TechSci Research
List of Figures Figure No. Title Figure 75: Europe Air Conditioners Market Share, By Country, By Value, 2016-2026F Figure 76: Russia Air Conditioners Market Size, By Value (USD Billion), By Volume (Million Units), 2016-2026F Figure 77: Russia Population, 2015-2019 (Million) Figure 78: Russia Air Conditioners Market Share, By Product Type, By Value, 2020 & 2026F Figure 79: Russia Light Commercial Air Conditioners Market Share, By Product Type, By Value, 20120 & 2026F Figure 80: Russia Air Conditioners Market Share, By End Use Sector, By Value, 2020 & 2026F Russia Air Conditioners Commercial End Use Market Share, By End Use Sector, By Value, 2020 & 2026F Figure 81: Figure 82: Italy Air Conditioners Market Size, By Value (USD Billion), By Volume (Million Units), 2016-2026F Figure 83: Italy Population, 2015-2019 (Million) Figure 84: Italy Air Conditioners Market Share, By Product Type, By Value, 2020 & 2026F Figure 85: Italy Light Commercial Air Conditioners Market Share, By Product Type, By Value, 2020 & 2026F Figure 86: Italy Air Conditioners Market Share, By End Use Sector, By Value, 2020 & 2026F Italy Air Conditioners Commercial End Use Market Share, By End Use Sector, By Value, 2020 & Figure 87: 2026F Figure 88: France Air Conditioners Market Size, By Value (USD Million), By Volume (Million Units), 2016-2026F Figure 89: France Population, 2015-2019 (Million) Figure 90: France Air Conditioners Market Share, By Product Type, By Value, 2020 & 2026F Figure 91: France Light Commercial Air Conditioners Market Share, By Product Type, By Value, 2020 & 2026F Figure 92: France Air Conditioners Market Share, By End Use Sector, By Value, 2020 & 2026F France Air Conditioners Commercial End Use Market Share, By End Use Sector, By Value, 2020 & Figure 93: 2026F 17 © TechSci Research
List of Figures Figure No. Title Figure 94: Spain Air Conditioners Market Size, By Value (USD Million), By Volume (Million Units), 2016-2026F Figure 95: Spain Population, 2015-2019 (Million) Figure 96: Spain Air Conditioners Market Share, By Product Type, By Value, 2020 & 2026F Figure 97: Spain Light Commercial Air Conditioners Market Share, By Product Type, By Value, 2020 & 2026F Figure 98: Spain Air Conditioners Market Share, By End Use Sector, By Value, 2020 & 2026F Spain Air Conditioners Commercial End Use Market Share, By End Use Sector, By Value, 2020 & 2026F United Kingdom Air Conditioners Market Size, By Value (USD Million), By Volume (Million Units), 2016-2026F Figure 99: Figure 100: Figure 101: United Kingdom Population, 2015-2019 (Million) Figure 102: United Kingdom Air Conditioners Market Share, By Product Type, By Value, 2020 & 2026F United Kingdom Light Commercial Air Conditioners Market Share, By Product Type, By Value, 2020 Figure 103: & 2026F Figure 104: United Kingdom Air Conditioners Market Share, By End Use Sector, By Value, 2020 & 2026F United Kingdom Air Conditioners Commercial End Use Market Share, By End Use Sector, By Value, Figure 105: 2020 & 2026F Middle East & Africa Air Conditioners Market Size, By Value (USD Billion), By Volume (Million Units), Figure 106: 2016-2026F Figure 107: Middle East & North Africa Population, 2015-2019 (Million) Figure 108: Middle East & Africa Air Conditioners Market Share, By Product Type, By Value, 2016-2026F Figure 109: Middle East & Africa Air Conditioners Market Share, By Product Type, By Volume, 2016-2026F Middle East & Africa Light Commercial Air Conditioners Market Share, By Product Type, By Value, Figure 110: 2016-2026F 18 © TechSci Research
List of Figures Figure No. Title Figure 111: Middle East & Africa Air Conditioners Market Share, By Country, By Value, 2016-2026F Saudi Arabia Air Conditioners Market Size, By Value (USD Billion), By Volume (Million Units), 2016- Figure 112: 2026F Figure 113: Saudi Arabia Population, 2015-2019 (Million) Figure 114: Saudi Arabia Air Conditioners Market Share, By Product Type, By Value, 2020 & 2026F Saudi Arabia Light Commercial Air Conditioners Market Share, By Product Type, By Value, 2020 & 2026F Figure 115: Figure 116: Saudi Arabia Air Conditioners Market Share, By End Use Sector, By Value, 2020 & 2026F Saudi Arabia Air Conditioners Commercial End Use Market Share, By End Use Sector, By Value, 2020 & 2026F Figure 117: Figure 118: Egypt Air Conditioners Market Size, By Value (USD Billion), By Volume (Million Units), 2016-2026F Figure 119: Egypt Population, 2015-2019 (Million) Figure 120: Egypt Air Conditioners Market Share, By Product Type, By Value, 2020 & 2026F Figure 121: Egypt Light Commercial Air Conditioners Market Share, By Product Type, By Value, 2020 & 2026F Figure 122: Egypt Air Conditioners Market Share, By End Use Sector, By Value, 2020 & 2026F Egypt Air Conditioners Commercial End Use Market Share, By End Use Sector, By Value, 2020 & Figure 123: 2026F Figure 124: UAE Air Conditioners Market Size, By Value (USD Billion), By Volume (Million Units), 2016-2026F Figure 125: UAE Population, 2015-2019 (Million) Figure 126: UAE Air Conditioners Market Share, By Product Type, By Value, 2020 & 2026F Figure 127: UAE Light Commercial Air Conditioners Market Share, By Product Type, By Value, 2020 & 2026F 19 © TechSci Research
List of Figures Figure No. Title Figure 128: UAE Air Conditioners Market Share, By End Use Sector, By Value, 2020 & 2026F UAE Air Conditioners Commercial End Use Market Share, By End Use Sector, By Value, 2020 & Figure 129: 2026F Turkey Air Conditioners Market Size, By Value (USD Billion), By Volume (Million Units), 2016-2026F Figure 130: Figure 131: Turkey Population, 2015-2019 (Million) Figure 132: Turkey Air Conditioners Market Share, By Product Type, By Value, 2020 & 2026F Figure 133: Turkey Light Commercial Air Conditioners Market Share, By Product Type, By Value, 2020 & 2026F Figure 134: Turkey Air Conditioners Market Share, By End Use Sector, By Value, 2020 & 2026F Turkey Air Conditioners Commercial End Use Market Share, By End Use Sector, By Value, 2020 & 2026F South America Air Conditioners Market Size, By Value (USD Billion), By Volume (Million Units), 2016-2026F South America Population (Million), By Select Country, 2015-2019 Figure 135: Figure 136: Figure 137: Figure 138: South America Air Conditioners Market Share, By Product Type, By Value, 2020-2026F Figure 139: South America Air Conditioners Market Share, By Product Type, By Volume, 2020-2026F South America Light Commercial Air Conditioners Market Share, By Product Type, By Value, 2020- Figure 140: 2026F Figure 141: South America Air Conditioners Market Share, By Country, By Value, 2020-2026F Figure 142: Brazil Air Conditioners Market Size, By Value (USD Billion), By Volume (Million Units), 2016-2026F Figure 143: Brazil Population, 2015-2019 (Million) Figure 144: Brazil Air Conditioners Market Share, By Product Type, By Value, 2020 & 2026F Figure 145: Brazil Light Commercial Air Conditioners Market Share, By Product Type, By Value, 2020 & 2026F 20 © TechSci Research
List of Figures Figure No. Title Figure 146: Brazil Air Conditioners Market Share, By End Use Sector, By Value, 2020 & 2026F Brazil Air Conditioners Commercial End Use Market Share, By End Use Sector, By Value, 2020 & 2026F Argentina Air Conditioners Market Size, By Value (USD Billion), By Volume (Million Units), 2016- 2026F Figure 147: Figure 148: Figure 149: Argentina Population, 2015-2019 (Million) Figure 150: Argentina Air Conditioners Market Share, By Product Type, By Value, 2020 & 2026F Argentina Light Commercial Air Conditioners Market Share, By Product Type, By Value, 2020 & 2026F Figure 151: Figure 152: Argentina Air Conditioners Market Share, By End Use Sector, By Value, 2020 & 2026F Argentina Air Conditioners Commercial End Use Market Share, By End Use Sector, By Value, 2020 & 2026F Colombia Air Conditioners Market Size, By Value (USD Billion), By Volume (Million Units), 2016- 2026F Figure 153: Figure 154: Figure 155: Colombia Population, 2015-2019 (Million) Figure 156: Colombia Air Conditioners Market Share, By Product Type, By Value, 2020 & 2026F Colombia Light Commercial Air Conditioners Market Share, By Product Type, By Value, 2020 & Figure 157: 2026F Figure 158: Colombia Air Conditioners Market Share, By End Use Sector, By Value, 2020 & 2026F Colombia Air Conditioners Commercial End Use Market Share, By End Use Sector, By Value, 2020 & Figure 159: 2026F 21 © TechSci Research
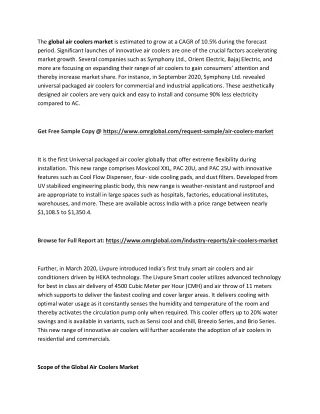
Scope of Report Product of Interest (POI): Air Conditioners Air conditioners are electrical appliances used to control humidity, ventilation, and temperature of a particular area. Based on product type, air conditioners can be segregated into chillers, VRFs, ductable splits, light commercial air conditioners and others. GLOBAL AIR CONDITIONERS MARKET GLOBAL AIR CONDITIONERS MARKET LIGHT COMMERCIAL AIR CONDITIONERS PRODUCT TYPE Market Segmentation Year Range Chillers • High Wall Splits • VRFs • Windows • Ductable Splits • Cassettes • Light Commercial Air • Review Period Concealed Ductable Splits • Conditioners 2016 – 2019 Others • Base Year REGION 2020 Europe • Estimated Year North America • 2021 Asia-Pacific • South America • Forecast Period Middle East & Africa • 2022 – 2026 23 © TechSci Research
Research Methodology Data Data Market Profiling Data Analysis Developing list of Respondents Formulating Questionnaire Collection Validation In-depth secondary research was conducted to determine top players in the global air conditioners market, overall market size and segmental market size. The data was scrutinized using MS-Excel, statistical tools and internal proprietary database to obtain qualitative and quantitative insights about the global air conditioners market. Data obtained as a result of primary and secondary research was validated through rigorous triangulation. TechSci conducted interviews with industry experts and industry players for data collection and verification. In order to conduct industry experts’ interviews, TechSci formulated a detailed discussion guide. List of industry players and industry specialists was developed. Primary Research Desk Research Company Analysis ✓ ✓ Recent Developments Market Changing Aspects/Dynamics Government Policies Final Conclusion ✓ ✓ Market Participants Key Strengths ✓ Identifying Key Opinion Leaders Questionnaire Design In-depth Interviews Actionable Insights Data Filter & Analysis Business Solution Research & Intelligence Data Collection ✓ ✓ ✓ ✓ Primary Research Secondary Research Paid Sources LinkedIn TechSci Internal Database Company Websites Company Annual Reports White Paper Study Financial Reports Investor Presentations Regulatory Body Associations, etc. Factiva Hoovers ✓ ✓ ✓ ✓ ✓ ✓ ✓ ✓ ✓ ✓ ✓ 25 25 © TechSci Research
Research Methodology Baseline Methodology Our dedicated team has analyzed the outlook of various segments of this market, while considering the major influencing factors such as soaring temperature and humidity, etc., which are expected to drive the growth of the market during the next 5 years. The study includes market forecasting, which would enable our clients to take better decisions while planning their strategy to achieve sustainability in the global air conditioners market. Methodology Followed for Calculation of Market Size: Market Size By Value & Volume : Market size, in terms of value & volume, for the year 2020 was calculated based on • information collected through exhaustive secondary research and primary surveys, with various key opinion leaders/stakeholders, such as air conditioners supplier companies, channel partners, utilities companies, market influencers & end users, industry experts, and other industry participants. The team interviewed more than 25 air conditioner companies, 500 end users and 10-15 industry experts in the global air • conditioners market to obtain the overall market size during 2016-2020, which was validated by the Delphi technique. Taking standard deviation into consideration, the market size was averaged out, to arrive at the market size data during 2016-2020. 26 26 © TechSci Research
Research Methodology Respondents were asked about the current and future market growth rates, market shares by product type, by end use sector, • and by each region. Removing the outlier responses, the geometric mean of growth estimates and supplier wise revenue shares generated across various segments were considered, to arrive at the final revenue shares. Revenue shares generated across various segments were further triangulated from other stakeholders depending upon the type of Air Conditioners. Methodology Followed for Forecasting: Market shares by product type, by end use sector, by region and by company were calculated based on the responses received • through primary surveys with industry experts, in which the respondents were asked about the market shares or revenue generated from various types of Air Conditioner segments. The final shares were calculated by taking the geometric mean of the responses gathered from key opinion leaders after eliminating the outliers. TechSci Research performed periodical checks on data collected through the surveys with logic checks and analyzed the survey • results in SPSS/Tableau Software. Data triangulation techniques were applied to fill the gaps and to present a more meaningful picture of the market. To forecast • Global Air Conditioners market, TechSci Research used various forecast techniques such as: Moving Average ✓ Time Series Analysis ✓ Regression Analysis ✓ Econometric and Judgmental Analysis ✓ 27 27 © TechSci Research
Research Methodology TechSci Research used its own forecast tool, which is based on the growth of various allied industries in respective regions. TechSci Research also used the impact analysis during short, medium and long term period to estimate and analyze the market demand scenario. It should be noted that the figures compiled are only for the organized market including market share data. The currency used in the report is the United States Dollar (USD), with the market size indicated in USD million. Partial List of Companies Interviewed Key Secondary Sources Daikin Industries, Ltd World Bank ▪ ▪ Gree Electric Appliances Inc. TechSci Research Proprietary Database & Knowledge ▪ ▪ Carrier Global Corporation Repository ▪ Midea Group Co., Ltd. Company Annual Reports ▪ ▪ Samsung Electronics Co. Ltd. Industry Magazines ▪ ▪ Panasonic Corporation BP Statistics ▪ ▪ Mitsubishi Electric Corporation Industry Reports ▪ ▪ Johnson Controls-Hitachi Air Conditioning News Dailies ▪ ▪ Limited Credible Paid Databases ▪ Toshiba Corporation ▪ Trane Technologies plc ▪ 28 28 © TechSci Research
Industry Brief According to TechSci Research report, “Global Air Conditioners Market By Product Type (Chillers, VRFs, Ductable Splits, Light Commercial Air Conditioners and Others), By Light Commercial Air Conditioners (High Wall Splits, Window Air Conditioners, Cassettes and Concealed Ductable Splits), By Region, Competition, Forecast Opportunities, 2026F”, the global air conditioners market is expected to reach USD138.03 billion by 2026F with a CAGR of 4.42% during forecast period. During the forecast period, sales of air conditioners are expected to increase due to a booming construction sector, rising disposable income, a growing real estate sector, and rising industrialization around the world. Governments in various countries are introducing various construction projects with the goal of improving infrastructure, which is expected to have a positive impact on global air conditioners market over the next five years. Temperatures are rising all over the world as a result of global warming, increasing demand for air conditioners. The primary driver of the global air conditioners market's growth is changing climatic conditions. Furthermore, the majority of emerging countries, which frequently experience rapid economic growth, are located partially (e.g., China or India, or coastal areas in Central and South America) or entirely (South-East Asia, Sub-Saharan Africa) in tropical areas. Their demand for air cooling is constantly increasing in order to improve consumer comfort. The National Oceanic and Atmospheric Administration (NOAA) reported that 2020 was the second-warmest year after 2016. This year-on-year increase in temperature thus aids the global growth of the air conditioners market. In 2020, air-conditioning components were in short supply due to a disruption in the supply chain, as China has completely shut down their manufacturing production, and every industry player around the world is connected to China in some way for the supply of equipment. Wuhan, Hubei Province, is the epicenter of the COVID-19 outbreak in central China, and it serves as a hub for US, European, and Japanese electronic suppliers. The global air conditioners market is segmented into by product type, by light commercial air conditioners, by region and by company. In terms of product type, the market can be segregated into Chillers, VRFs, Ductable Splits, Light Commercial Air Conditioners and Others. Out of these, light commercial air conditioners market had registered highest market share of around more than 75% among all air conditioners products followed by chillers in 2020, whereas VRFs are the fastest growing segment in the air conditioners market. In terms of light commercial air conditioners market, high wall splits have accounted for the majority of market share in the global air conditioners market followed by windows, owing to their various advantages such as energy efficiency, lower running cost, easy availability and integration of latest technologies. Inverter-based split air conditioners are an emerging technology and is expected to gain popularity in the coming years on account of high level of energy efficiency and lower running cost. In terms of regional analysis, the global air conditioners market is segment into Asia-Pacific, Europe, North America, South America and Middle East & Africa. Among these, the Asia-Pacific region is dominating the global air conditioners market followed by North America in 2020. Air conditioners are in high demand in countries with large populations, such as China, Japan, and India. Changing climatic conditions, combined with a growing consumer preference for lifestyle-oriented products, have fueled the growth of the Asia- Pacific air conditioners market over the years. In 2020, North America became the world's second largest market for air conditioners. Growth in air conditioner demand in North America can be attributed to an increasing population base, rising consumer purchasing power, growing urbanization, and a growing preference for lifestyle-oriented products. In terms of company, major players operating in global air conditioners market include Daikin Industries, Ltd., Gree Electric Appliances Inc., Carrier Global Corporation, Midea Group Co., Ltd., Samsung Electronics Co., Ltd. and others. Among which Daikin Industries, Ltd., have accounted the majority of market share in 2020 in the global air conditioners market. Leading players are focusing on expanding their product portfolios to maintain sustainable growth in the market. The companies are also expanding their distribution reach across various countries and surge in the distribution of air conditioners in the market. “The global air conditioners market is anticipated to register healthy growth during forecast period. Factors such as rapid economic development of emerging economies, growing demand for energy efficient air conditioners across the globe, growing smart home market, easy financing & emergence of new payment modes, solar hybrid air conditioners are booming the demand of air conditioners market globally”. said Mr. Karan Chechi, Research Director with TechSci Research, a research-based global management consulting firm. 29 © TechSci Research
Sample Data - Snapshot Global Air Conditioners Market Size, By Value (USD Billion), By Volume (Million Units), 2016-2026F CAGR 2021E-2026F By Value: xx% By Volume: xx% CAGR 2016-2020 By Value: xx% By Volume: xx% 2016 2017 2018 2019 Value (USD Billion) 2020 2021E 2022F 2023F 2024F 2025F 2026F Volume (Million Units) North America Air Conditioners Market Share, By Product Type, By Value, 2016-2026F 2016 2017 2018 2019 2020 2021E 2022F 2023F 2024F 2025F 2026F Light Commercial Air Conditioners 50.00% 50.00% 50.00% 50.00% 50.00% 50.00% 50.00% 50.00% 50.00% 50.00% 50.00% VRFs 20.00% 20.00% 20.00% 20.00% 20.00% 20.00% 20.00% 20.00% 20.00% 20.00% 20.00% Chillers 15.00% 15.00% 15.00% 15.00% 15.00% 15.00% 15.00% 15.00% 15.00% 15.00% 15.00% Ductable Splits 10.00% 10.00% 10.00% 10.00% 10.00% 10.00% 10.00% 10.00% 10.00% 10.00% 10.00% Others 5.00% 5.00% 5.00% 5.00% 5.00% 5.00% 5.00% 5.00% 5.00% 5.00% 5.00% United States Air Conditioners Market Size, By Value (USD Million), By Volume (Million Units), 2016-2026F CAGR 2016-2020 By Value: xx% By Volume: xx% CAGR 2021E-2026F By Value: xx% By Volume: xx% 2016 2017 2018 2019 By Value (USD Billion) 2020 2021E 2022F By Volume (Million Units) 2023F 2024F 2025F 2026F 30 © TechSci Research
Report Ordering Report Name: GLOBAL AIR CONDITIONERS MARKET FORECAST & OPPORTUNITIES 2016 – 2026F License Type Price Single User License $4900 Multi-User License $5900 Custom Research License $8900 To View Sample OR Purchase Report 31 © TechSci Research
About Us & Disclaimer TechSci Research is a global market research and consulting company with offices in the US, UK and India. TechSci Research provides market research reports in number of areas to organizations. The company uses innovative business models that focus on improving productivity, while ensuring creation of high-quality reports. The proprietary forecasting models use various analyses of both industry-specific and macroeconomic variables on a state-by-state basis to produce a unique ‘bottom-up’ model of a country, regional and global industry prospects. Combined with the detailed analysis of company activity and industry trends, the result is a uniquely rich evaluation of the opportunities available in the market. Related Reports Saudi Arabia Air Conditioners Market By Product Type (Light Commercial Air Conditioner, Ductable Splits, VRF, Chiller and Others), By Region (Asia-Pacific, North America, Europe, South America and MEA), Competition Forecast & Opportunities, 2025 • India Air Conditioners Market By Product Type (Light Commercial Air Conditioners, Ductable Splits, VRF, Chillers, and Others), By End Use Sector (Residential, Commercial and Industrial), Competition Forecast & Opportunities, 2025 • TechSci Research – North America 708 Third Avenue, Manhattan, New York, United States Tel: +1- 646- 360- 1656 Email: sales@techsciresearch.com www.techsciresearch.com TechSci Research – Europe 54, Old brook, Bretton, Peterborough, United Kingdom Email: sales@techsciresearch.com www.techsciresearch.com TechSci Research – Asia-Pacific B – 44, Sector – 57, Noida, National Capital Region, U.P. - India Tel: +91-120-4523900 Email: sales@techsciresearch.com www.techsciresearch.com Disclaimer The contents of this report are based on information generally available to the public from sources believed to be reliable. No representation is made that it is timely, accurate or complete. TechSci Research has taken due care and caution in compilation of data as this has been obtained from various sources including which it considers reliable and first hand. However, TechSci Research does not guarantee the accuracy, adequacy or completeness of any information and it is not responsible for any errors or omissions or for the results obtained from the use of such information and especially states that it has no financial liability whatsoever to the subscribers / users of this report. The information herein, together with all estimates and forecasts, can change without notice. All the figures provided in this document are indicative of relative market size and are strictly for client’s internal consumption. Usage of the same for purpose other than internal will require prior approval of TechSci Research.