Download
1 / 8
80 likes | 214 Views
IGS Project Iceland Group 7. Jesper Sundien Petter Holmberg Alexander Harju Shaman Mahmoudi. Program Features. Visualizes seismic events in the Iceland region using a visually pleasing 3D representation of geographic and seismic data.

E N D
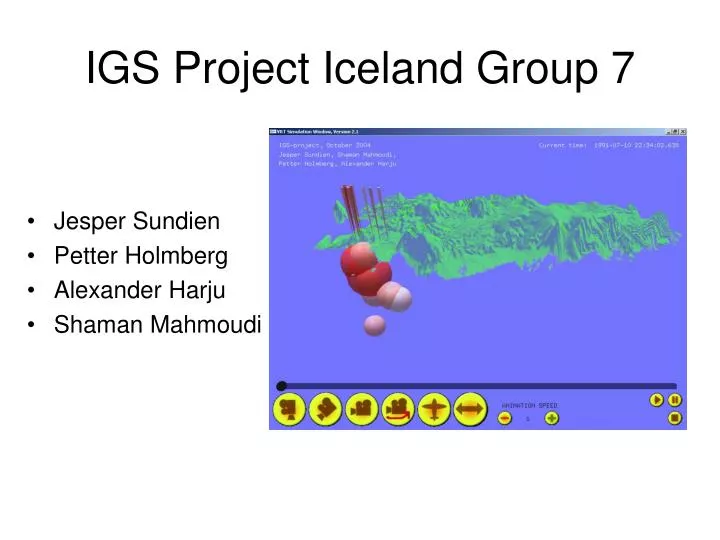
IGS Project Iceland Group 7 • Jesper Sundien • Petter Holmberg • Alexander Harju • Shaman Mahmoudi
Program Features • Visualizes seismic events in the Iceland region using a visually pleasing 3D representation of geographic and seismic data. • Allows the user to interactively select which seismic events to view, in regard to temporal and spatial context. • Allows the user to freely view the seismic events from any angle and distance by modifying these preferences in real-time.
Visualization of Seismic Events • Seismic events are represented as colored, semi-transparent spheres centered at the origin of the event relative to the geographical representation of the area. • The size of an event sphere represents its spread (distance) factor. • The color of an event sphere represents its magnitude factor. Weak events are almost white, and the stronger the event is, the more red it will appear. • To allow the user to easily locate the geographic position of the event on the terrain surface, a narrow cone, centered at the event, is drawn through the terrain surface.
The Graphical User Interface • The user controls the entire application with a mouse. • Visualization preferences for the data, including preset viewing angles, are modified with an intuitive button interface controlled by left-clicking. • Viewing angle and distance of the map is controlled by using the right or both mouse buttons at once and moving the mouse pointer.
Controlling the data selection • The user controls the data parameters with plus and minus buttons using the mouse. • Confirm selection with OK button. • Play, stop and pause buttons are used to control the animation. • Animimation speed can also be changed.