Download
1 / 29
290 likes | 308 Views
Dive into the scope and rationale of biometric genetics to grasp the covariance structure of twin data influenced by genetic and environmental factors. Explore Mendel's Laws, quantitative traits, familial covariation, and more.

E N D
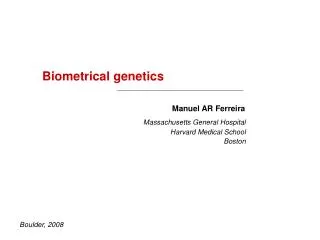
Biometrical Genetics Pak Sham & Shaun Purcell Twin Workshop, March 2002
Aims • To gain an appreciation of the scope and rationale of biometric genetics • To understand how the covariance structure of twin data is determined by genetic and environmental factors
Maternal A3 A4 ½ ½ A1 A1 A3 A4 ½ ¼ ¼ A1 Paternal A2 A2 A2 A3 A4 ½ ¼ ¼ Mendel’s Law of Segregation
Classical Mendelian Traits • Dominant trait D, absence R • AA, Aa D; aa R • Recessive trait R, absence D • AA D; Aa, aa R • Co-dominant trait, X, Y, Z • AA X; Aa Y; aa Z
Biometrical Genetic Model Genotype means 0 AA m + a -a +a d Aa m + d aa m – a
Quantitative Traits • Mendel’s laws of inheritance apply to complex traits influenced by many genes • Assume 2 alleles per loci acting additively Genotype AA Aa aa Phenotype 1 0 -1 • Multiple loci • Normal distribution of continuous variation
1 Gene 3 Genotypes 3 Phenotypes 2 Genes 9 Genotypes 5 Phenotypes 3 Genes 27 Genotypes 7 Phenotypes 4 Genes 81 Genotypes 9 Phenotypes Quantitative Traits Central Limit Theorem Normal Distribution
Continuous Variation 95% probability 2.5% 2.5% -1.96 1.96 0 Normal distribution Mean , variance 2
Familial Covariation Bivariate normal disttribution Relative 2 Relative 1
Covariance Algebra Forms Basis for Path Tracing Rules
Covariance and Correlation Correlation is covariance scaled to range [-1,1].
Genotype Frequencies (random mating) A a A p2 pqp a qpq2 q p q Hardy-Weinberg frequencies p(AA) = p2 p(Aa) = 2pq p(aa) = q2
Biometrical Model for Single Locus Genotype AA Aa aa Frequency p2 2pq q2 Deviation (x) a d -a Residual var 2 2 2 Mean m = p2(a) + 2pq(d) + q2(-a) = (p-q)a + 2pqd
Genetic Variance under Random Mating Genotype AA Aa aa Frequency p2 2pq q2 (x-m)2 (a-m)2 (d-m)2 (-a-m)2 Variance = (a-m)2p2 + (d-m)22pq + (-a-m)2q2 = 2pq[d+(q-p)d]2 + (2pqd)2 = VA + VD
a d m -a Additive and Dominance Variance aa Aa AA Total Variance = Regression Variance + Residual Variance = Additive Variance + Dominance Variance
Cross-Products of Deviations for Pairs of Relatives AA Aa aa AA (a-m)2 Aa (a-m)(d-m) (d-m)2 aa (a-m)(-a-m) (-a-m)(d-m) (-a-m)2 The covariance between relatives of a certain class is the weighted average of these cross-products, where each cross-product is weighted by its frequency in that class.
Covariance for MZ Twins AA Aa aa AA p2 Aa 0 2pq aa 0 0 q2 Covariance = (a-m)2p2 + (d-m)22pq + (-a-m)2q2 = 2pq[d+(q-p)d]2 + (2pqd)2 = VA + VD
Genotype tables : Parent-offspring AA Aa aa AA p2 Aa 0 2pq aa 0 0 q2
Genotype tables : Unrelated AA Aa aa AA p4 Aa 2p3q 4p2q2 aa p2q2 2pq3 q2 Covariance = … = 0
Genotype tables : DZ twins AA Aa aa AA p4 Aa 2p3q 4p2q2 aa p2q2 2pq3 q2 • Weighted average • ¼ MZ twins • ½ Parent-offspring • ¼ Unrelated Covariance = … = ½VA+¼VD
Environmental components • Shared (C) • Correlation = 1 • Nonshared (E) • Correlation = 0
ACE Model for twin data 1 [0.5/1] E C A A C E e c a a c e PT1 PT2
Components of variance Phenotypic Variance Environmental Genetic GxE interaction
Components of variance Phenotypic Variance Environmental Genetic GxE interaction Additive Dominance Epistasis
Components of variance Phenotypic Variance Environmental Genetic GxE interaction Additive Dominance Epistasis Quantitative trait loci