Download
1 / 54
560 likes | 809 Views
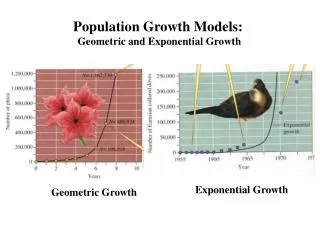
Population Growth Models and Resource consumption. Caitlin Thomas November 12, 2009. Presentation Overview. Population Growth Models General Population Growth Model Mathematical Models Exponential Growth Model Logistic Growth Model Cohort-Component Model Systems Models

E N D
Population Growth Models and Resource consumption Caitlin Thomas November 12, 2009
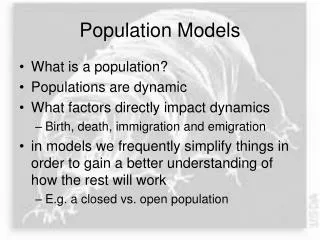
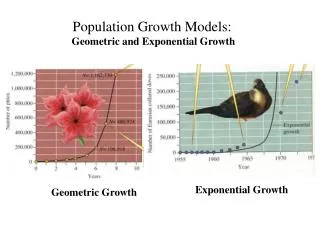
Presentation Overview • Population Growth Models • General Population Growth Model • Mathematical Models • Exponential Growth Model • Logistic Growth Model • Cohort-Component Model • Systems Models • Why Population Growth Matters • Resource Consumption/Management • Non-Renewable Resources • Renewable Resource
General Population Growth Model In general, the rate of change for any quantity can be modeled as: For biological populations specifically, the model lookslike:
General Population Growth • For mobile populations that can move from one place to another (primary example: humans), we must also take into consideration net migration • So our population growth rate equation becomes: • Net Migration = Immigration – Out Migration
General Population Growth Model Birth Rate and Death Rate are fixed and normalized (divided by the total population size): B, D, M can be: • constants, • functions of time, • or functions of population size B = birth rate = number of births per unit time per unit population P D = death rate = number of deaths per unit time per unit population P M = net migration = number of migrations per unit time per unit population P
General Population Growth Model By substitution into We have:
Exponential Growth Model • Consider if a population has birth, death, and migration rates that remain constant over time. • Birth Rate = B • Death Rate = D • Migration Rate = M • Let , for k a constant • Then the population growth rate equation becomes:
Exponential Growth Model We can now solve for the total population as a function of time, P(t).
Exponential Growth Model Now, consider the Initial Value Problem: For t = 0: Where P0 is the initial size of the population.
Exponential Growth Model Question 1: At the start of an experiment, there are 100 bacteria. If the bacteria follow an exponential growth pattern with rate k = 0.02: (a) What will be the size of the population after 5 hours?
Exponential Growth Model Question 1: At the start of an experiment, there are 100 bacteria. If the bacteria follow an exponential growth pattern with rate k = 0.02: (b) How long will it take for the population to double?
Exponential Growth Model Question 1: But what if k = 0.03?
Exponential Growth Model • Consider exponential model of the population of the United States: • Consider if k = 0.01
Exponential Growth Model • Now, consider if k = 0.02 • k = 0.02 predicts an extra 13 MILLION people!
Exponential Growth Model • But does an exponential growth equation give us an accurate model for population growth? • No. • Why? • Populations cannot continue to grow at an exponential rate forever: • Availability of resources
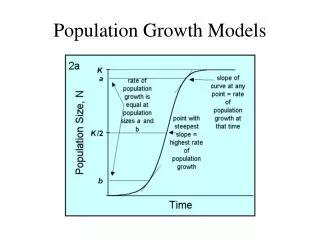
Carrying Capacity • Carrying Capacity: “the maximum population size that can be supported by the available resources of the environment” • The logistic model of population growth takes the carrying capacity of an environment into account
Logistic Growth Model • In the logistic growth model: • And the annual increase rP is decreased by a factor of how close the population size is to the carrying capacity (1– P/M) P = population size; P(t) r = annual rate of population increase M = carrying capacity of the environment
Logistic Growth Model • The sign of dP/dt changes for different values of P
Logistic Growth Model • So, when we solve for P(t), we get: • And:
Logistic Growth Model Consider for different values of P0
Logistic Growth Model Question 3: Draw a rough sketch of the graph of P(t) for: And label the lines of equilibrium on the graph. Equilibrium P = 150,000 P(t) Equilibrium P = 0 P(0) = 500
Comparing Logistic and Exponential • Consider for: • P0 = 100 • M = 2,000 • r = 0.02; k = 0.02 (for each equation respectively) • We have:
Comparing Logistic and Exponential • So the Logistic Model gives us a more realistic representation of population growth under the constraint of limited resources
Problems with Mathematical Models • But all mathematical population growth models share one fatal flaw: • Assume that future population size is determined by present and past population sizes only • Mathematical models have no visible connection to the observable measures of human population growth • Ignores the age and sex composition of current populations
Problems with Mathematical Models • Population A =100 million people aged 60 and older • Population B = 100 million people aged 20-45 Birth Rate A < Birth Rate B Death Rate A > Death Rate B We would NOT expect Population A and Population B to grow at the same rate
Problems with Mathematical Models • Population C =200,000 men in an isolated gold-rush mining town • Population D = 100,000 men + 100,000 women We would NOT expect Population C and Population D to grow at the same rate Birth Rate C < Birth Rate D
Cohort Component Growth Model • The demographic composition of a population matters • The Cohort-Component method predicts future size of each subgroup of a population individually • Used by the U.S. Census Bureau to predict future population size
Cohort Component Growth Model • U.S. Census Bureau • Base Population • Plus births to U.S. resident women • Minus deaths to U.S. residents • Plus net international migrants • In its most simple form: • Pt+1 = Pt+ Bt,t+1 – Dt,t+1+ Mt,t+1 Pt = population at time t;Pt+1 = population at time t+1;Bt,t+1 = births, in the interval from time t+1 to time t;Dt,t+1 = deaths, in the interval from time t+1 to time t; andMt,t+1 = net migration, in the interval from time t+1 to time t
Cohort Component Growth Model Female Population Surviving population New births
Cohort Component Growth Model Male Population Surviving population New births
Cohort Component Growth Model Si, t+1 = Surviving Population in age group i at time t+1 Bi-1, t = Base population in age group i-1 at time t Di-1 = Death rate for age group i-1 Mi-1 = Net migration of individuals in age group i-1 between t and t+1 bi = Birth rate for age group i Surviving population New births
Cohort Component Growth Model 2007 • The total fertility rate for each age group is not the same 1990 2007 http://www.cdc.gov/nchs/data/nvsr/nvsr57/nvsr57_12.pdf
Cohort Component Growth Model White Black • Furthermore, the total fertility rate for each age group is different across races http://www.cdc.gov/nchs/data/nvsr/nvsr57/nvsr57_12.pdf http://www.cdc.gov/nchs/data/statab/t991x07.pdf
Cohort Component Growth Model • The U.S. Census Bureau calculates the population for each age, sex, race, and Hispanic origin subgroup • P female, white, non-Hispanic origin, 15-19 • P male, black, non-Hispanic origin, 40-44 • So the predicted total population at time t+1 is the sum of the predicted populations of all subsets at time t+1 • So, as you can imagine, to actually calculate this for a real population gets very complicated!
System Models of Population Growth • System models • For the large part, ignore detailed age and sex composition of population • Capture quantitative interactions between population growth and size and non-demographic factors like industrialization, agriculture, pollution, natural resources • Economic, political, environmental, and cultural factors • But even most ambitious efforts so far show that we don’t have the capabilities/our knowledge is not yet up to the task of modeling population growth in this way
Resource Consumption Non-Renewable Resources • If the fixed amount, S, is consumed at a constant rate, U, per year • The supply will last for S/U years • S/U is called the static reserve • Important for: • Gasoline, coal, natural gas
Resource Consumption Non-Renewable Resources • But what if the fixed amount, S, is not consumed at a constant rate? • The rate of resource consumption is dependent upon: • Population growth • Increasing standards of living
Resource Consumption • Let Uk be the consumption in year k • Let consumption increase by a fixed rate. Let r = 0.05 • Then: • So, in year k: • Total usage over the next five years would be:
Resource Consumption • Let total amount of the resource that has been used by the end of n years • And now set S = A • And after solving for n
Resource Consumption Population growth makes a difference!
Resource Consumption • But what about renewable resources? • If:
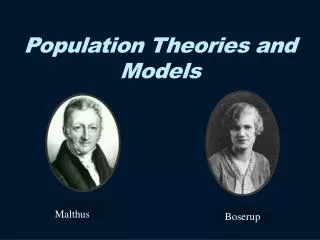
Malthus Agreed • Thomas Malthus (1766-1834) • “The power of population is indefinitely greater than the power in the earth to produce subsistence for man. Population, when unchecked, increases in a geometrical ratio. Subsistence increases only in an arithmetical ratio. A slight acquaintance with numbers will show the immensity of the first power in comparison with the second." Malthus T.R. 1798. An essay on the principle of population.
Is this guy right? • Developing countries • Faster population growth rates than more developed/industrialized nations • 2.8% in Nigeria • 135 million in 2007 – 231 million in 2030 • Concerns for providing sufficient food and resources for everyone
Is that guy right? • Social Security Baby Boom Baby Boom
Is that guy right? • Social Security • Dependency Ratio • Trends not just in US: also in Europe and Japan (Number of people aged 65+) Aged Dependency Ratio = (Number of people aged 15-64) Total Dependency Ratio per 100 people of “working age” (15-64) Source: Congressional Research Service, Age Dependency Ratios and Social Security Solvency (2006)
Is that guy right? • But maybe it’s not so bad: • Total dependency ratio is what matters (Number of people aged 0-14)+(Number of people aged 65+) Total Dependency Ratio = (Number of people aged 15-64) We can handle it; it’s been worse! Total Dependency Ratio per 100 people of “working age” (15-64) Source: Congressional Research Service, Age Dependency Ratios and Social Security Solvency (2006)
Is that guy right? • But maybe it’s not so bad: • Change in composition of dependency ratio from change in population structure: But does supporting one child = one retiree?
Is that guy right? • Social Security cannot pay full benefits in 2042 • 2018 first year that benefits are larger than payroll taxes • 2028 first year benefits are larger than payroll taxes plus interest • 2028-2042 start spending down surplus • 2042 year trust fund assets are exhausted Social Security not bankrupt (still have payroll taxes coming in) • Social Security cannot pay full benefits after this point • Can cover maybe 80% of benefits • Disability cannot pay full benefits in 2025 • Medicare cannot pay full benefits in 2019 • Has already started using interest on surplus http://www.ssa.gov/OACT/TR/