Download
1 / 17
170 likes | 385 Views
Impact of the changes of prescribed fire emissions on regional air quality from 2002 to 2050 in the southeastern United States. Tao Zeng 1,3 , Yuhang Wang 1 , Chi Zhang 2 , Hanqin Tian 2 , Di Tian 3 , Amistead G. Russell 1 , Yongqiang Liu 4 , Ruby Leung 5. 1 Georgia Institute of Technology

E N D
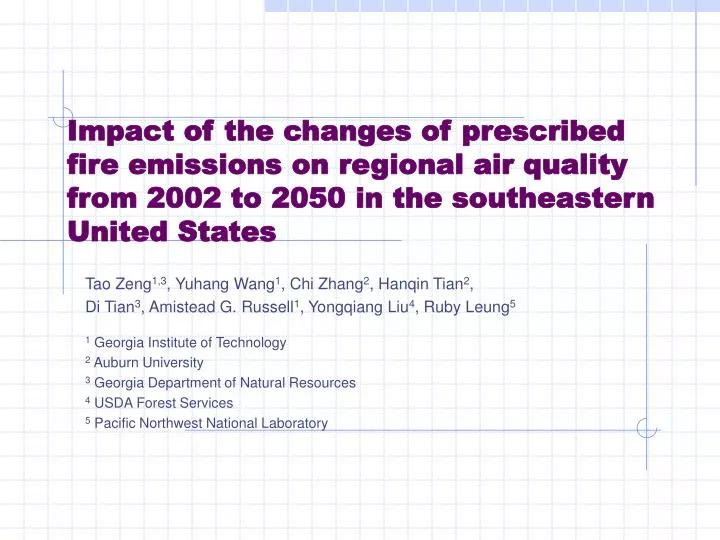
Impact of the changes of prescribed fire emissions on regional air quality from 2002 to 2050 in the southeastern United States Tao Zeng1,3, Yuhang Wang1, Chi Zhang2, Hanqin Tian2, Di Tian3, Amistead G. Russell1, Yongqiang Liu4, Ruby Leung5 1 Georgia Institute of Technology 2 Auburn University 3 Georgia Department of Natural Resources 4 USDA Forest Services 5 Pacific Northwest National Laboratory
Outline • Prescribed fire emissions (PFE) in the SE US in 2002 • Projection of PFE from 2002 to 2050 based on fuel loading changes projected with a dynamic ecosystem model • CMAQ simulated PFE impacts on regional air quality in 2050 • Conclusions
Prescribed burning is fire ... Applied in a skillful manner Under exacting weather conditions In a definite place To achieve specific results — A Guide for Prescribed Fire in Southern Forests The impacts Reduce fire hazards Improve wildlife habitat Improve access Reduce air quality Prescribed burning in the SE US in 2002 --- VISTAS fire inventory VISTAS fire inventory The mean and median OC and EC concentrations in the SE US from the observation and model simulations with and without prescribed fire emissions in March 2002. (Zeng et al., 2008)
Emission Projection of PFE in 2050 Fire Emission = Burned Area xFuel loadingx Emission Factor • Fuel loading projection The base fuel loading condition is provided by Fuel Characteristic Classification System (FCCS) map developed by USDA Forest Service (Roger Ottmar). The Dynamic Land Ecosystem Model (DLEM)at Auburn University is used to estimate the temporal and spatial patterns of fuel loading driven by the meteorological simulations in 2002 and 2050. • Future climate Future climate in 2050 is simulated based on IPCC A1B scenario. GISS GCM is used for the climate simulation (Mickley, et al., 2004 ). The global outputs were downscaled to 36-km North America model domain using the MM5 (Leung et al., 2005). • Emission prediction in 2050 The future emission up to 2020 was developed by following the Clean Air Interstate Rule (CAIR) controls. From 2020 to 2050, the emissions were predicted based on IPCC A1B scenario by the Integrated Model to Assess the Global Environment (IMAGE) model (www.mnp.nl/image) [Woo et al., 2008].
(a) Spatial pattern Seasonal variation Temporal pattern 2002 vs. 2050 Fuel loading estimate in 2050 Fuel Characteristic Classification System (FCCS, Ottmar et al.) Current annual mean fuel loading Fuel Loading in 2002 and 2050 Spatial and temporal distributions of biomasses in 2002 and 2050 Dynamic Land Ecosystem Model (DLEM, Auburn U.) VEGETATION Climate (TEMP,PPT) Atmospheric CO2 Soil (BD, PH, DEPTH, SILT, CLAY) Topography (ELEV, SLOPE, ASPECT)
Fuel loading in 2002 vs 2050 Temperature changes (2002 vs. 2050) Precipitation changes (2002 vs. 2050)
Prescribed fire emissions (PFE) in 2050 DLEM simulated fuel loadings in the 10 SE states in 2002 and 2050. PFE projection The ratios of annual fuel loading at county level are used to scale PFE from 2002 to 2050. PFE 2050 : PFE 2002 = 1.16
CMAQ simulation • Domain • 147 columns, 111 rows, 9 vertical layers, 36km grid distance • Meteorology • 2002 MM5 data assimilations driven by NNRP and ADP obs. • 2050 MM5 simulations based on GISS GCM with 2xCO2 • Emissions • Projected PFE from VISTAS emissions inventory in 2002 • Projected anthropogenic emissions in 2050 [Woo et al., 2008] • Chemistry • SAPRC99_AE4_aq including SOA productions. • Initial & boundary conditions • GEOS-Chem CO (for evaluation of CO in 2002) • Default CMAQ setting for the others. • Runs • Two base runs with standard emissions in 2002 and 2050. • Two sensitivity runs without PFE in the SE US in 2002 and 2050. • One sensitivity run with 2002 PFE in 2050.
Conclusions • Projected 2050 PFE from 2002 increases in the states along the east coast and decreases in the inland states in the SE US. The total projected PFE in 2050 is 16% higher than 2002 since most PFE occurs in FL, GA, AL, SC. • The impact of PFE on CO, EC, OM, and PM2.5 is larger in winter and spring in both years. February and March are the 2 months with the largest impacts. • The model simulates the largest PFE impact on air quality in February although March has the largest PFE. It indicates a big role of the meteorological conditions. • The simulated PM2.5 enhancements due to PFE are 2.2 and 1.3 μg/m3 in February 2002 and 2050, respectively. It accounts for 22% and 25% of total PM2.5 mass in Feb 2002 and 2050. The simulated annual PFE contributions are 14% and 17% in 2002 and 2050, respectively. • Same amount of PFE leads to smaller air quality changes in 2050. It is due to changes of meteorological conditions.
Acknowledgement • This work was funded by the US EPA 2004-STAR-L1 Program (grant RD-83227601) and USDA Air Quality Program (grant 2007-55112-17855). • I want to thank Dr. Kuo-Jen Liao and Dr. Yongtao Hu at Georgia Tech for insightful discussion and Dr. Jung-Hun Woo at NESCAUM for providing the emission data in 2050.