Download
1 / 12
120 likes | 281 Views
PRODUCT MARKET. Goods and. Goods. services. and services. bought. sold. HOUSEHOLDS. FIRMS. Affect on Circular Flow?. Labor, land,. Factors of. capital & entrepreneurship. production. FACTOR Market. Wages, rent,. and profit. Circular Flow. Spending. Revenue. Price of Oil

E N D
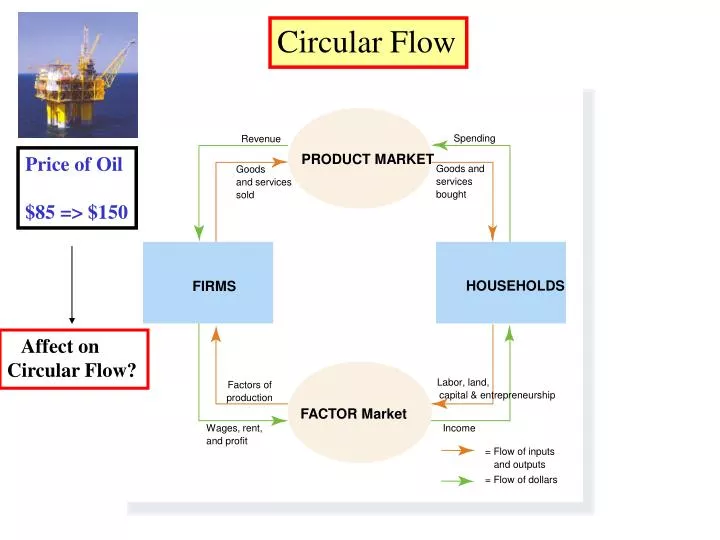
PRODUCT MARKET Goods and Goods services and services bought sold HOUSEHOLDS FIRMS Affect on Circular Flow? Labor, land, Factors of capital & entrepreneurship production FACTOR Market Wages, rent, and profit Circular Flow Spending Revenue Price of Oil $85 => $150 Income = Flow of inputs and outputs = Flow of dollars
Business Cycle 2000 2006 Housing Bubble 1990’s Technology Boom Great Recession 2012 2001 ? 2008-09
Production Possibilities Frontier 1st Economic Graph
Production Possibilities Frontier • Concepts illustrated by PPF: • Efficiency, Trade-offs, Opportunity cost, Economic growth • Assumptions: country uses all of its resources to produce only 2 goods 2nd Economic Model
Any point above line is Unobtainable in Short Run with existing technology & resources (0,100) (50,50) Any point on line is Efficient production of goods (100, 0) Any point below line is Inefficient Productions Possibility Frontier • Constant Cost PPF Graph (straight line PPF) Qty Food . C . B . A Qty Shelter
Which Society is more EFFICIENT? Assumptions:-produce only 2 goods -same resources for both countries Country A Country B
Straight Line PPF • Slope = Opportunity Cost . A Qty Food Opportunity Cost point A → B: 10 . B 5 ---------- ----------- 10 5 Qty Shelter
B C Increasing Opportunity Cost! 800 “Bowed” PPF Curve Quantity Houses .A Move from Point A B Opportunity Cost of gaining 400 Cars is 100 Houses Gain 1 Car Give up 1/4 House 1,000 Move from Point B C Opportunity Cost of gaining 400 Cars is 200 Houses Gain 1 Car Give up 1/2 House -------------- 900 700 ------------------------------- Quantity 400 0 1,000 Cars
Increasing vs. Constant Costs Straight line PPF curves have Constant Opportunity Costs Bowed PPF curves have Increasing Opportunity Costs
4,000 3,000 G 2,300 2,200 A You get more from same scarce resources! 600 650 1,000 Economic Goal: Shift PPF outward Qty of Computers Increased Efficiency (productivity) will shift PPF curve outward Qty of 0 Cars
PPF Summary • PPF Line represents all efficient production points • Points below PPF are inefficient(not using resources fully) • Points above PPF are not attainable in short run • Cannot attain it with existing technology & resources • “Bowed” PPF curves have increasingopportunity cost • Straight Line PPF curves have constant opportunity cost • Long Run goal is to shift the line outward (become more efficient)