Download
1 / 23
240 likes | 498 Views
Flow Simulation of a Maple Seed. Jake Holden Thomas Caley Dr. Mark Turner. Goals & Objectives. Question to answer: “How has time optimized this natural wind turbine? ” Understand/discover the physical and rotational properties of the maple seed

E N D
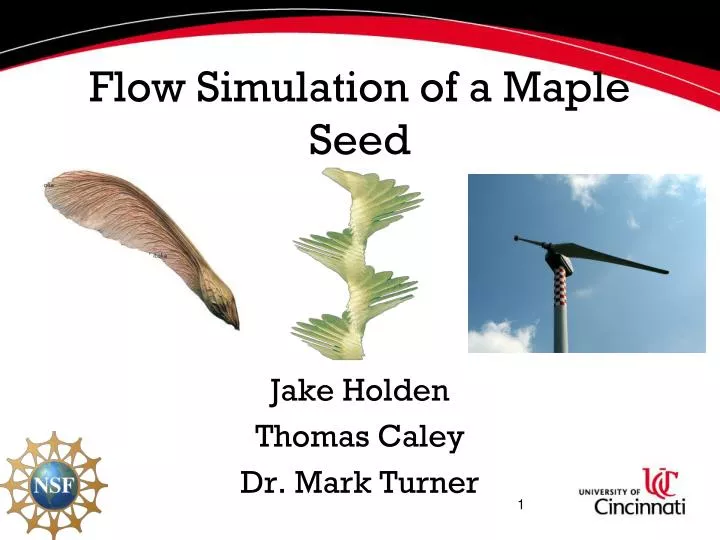
Flow Simulation of a Maple Seed Jake Holden Thomas Caley Dr. Mark Turner
Goals & Objectives • Question to answer: “How has time optimized this natural wind turbine?” • Understand/discover the physical and rotational properties of the maple seed • Simulate the flow field of a falling maple seed • Post-process the results to analyze and understand the flow field • Modify standard conditions and design to explore wind turbine potentials
Accomplishments • Collected Seed samples (12) • CT Scans of seeds to acquire 3D model • Recorded falling maple seeds with high-speed camera at 3000 frames/second • Quantified high-speed data (rotation speed, angle of rotation, and fluid velocity) • Computational Fluid Dynamics (CFD) simulation of seed falling in duct to analyze work done by seed
CT Scans 1. Seeds were placed in foam fixture on their back edge to prevent blade distortion and allow multiple parts per scan. 2. Fixture was placed in machine on turntable
3D Geometry CT scanning time takes about 1.5 hours, then final model must be constructed in proprietary software *All geometry thanks to Exact Metrology donating time and expertise
High-Speed Data (1 of 2) Species 1 Species 2 Species 3
High-Speed Data (2 of 2) Species 1 Species 2 Species 3
Computational Fluid DynamicsWorkflow Geometry (CT Scans) Grid Fluid Volume Establish Models & Assumptions Run CFD Solver Post Process Solution
Assumptions/Model • Pressure outlet wall and rotating seed body • Incompressible Flow • Steady Flow • Three-Dimensional • Turbulence Modeling (k-ε) • No structural deflection (rigid body)
CFD Simulation (1 of 8) Cylindrical Domain Grid Generation ≈ 2 million pts
CFD Simulation (2 of 8) Relative Velocity Stream tubes extended in both directions to show fluid as seen by the seed
CFD Simulation (3 of 8) Relative Velocity Stream tubes on Pressure (bottom) and Suction (top) sides
CFD Simulation (4 of 8) Relative Velocity Stream tubes on Pressure (bottom) and Suction (top) sides
CFD Simulation (5 of 8) Relative Velocity Stream tubes at Leading Edge
CFD Simulation (6 of 8) Relative Velocity Stream tubes looking from tip to seed illustrating Leading Edge incidences
CFD Simulation (7 of 8) Suction Side (Top) Pressure Side (Bottom) Seed Static Pressure Contours
CFD Simulation (8 of 8) Outlet Inlet Relative Total Pressure contours on the inlet and outlet of the duct (*notice the average drop in Pt)
Performance Analysis (1 of 2) • Figures of Merit: • Axial Induction Factor • Lift vs. Weight
Next Steps • Balance Lift & Weight by tweaking flow velocity and rotational velocity • Modify geometry to observe how specific features impact flow characteristics • Draw comparisons and continue analyzing in terms of wind turbine performance
References • Sairam, K. (2013) “The influence of Radial Area Variation on Wind Turbines to the Axial Induction Factor”, M.S. Thesis, University of Cincinnati, Cincinnati, Ohio • Normberg, R. A. “Auto-Rotation, Self-Stability, and Structure of Single-winged Fruits and Seeds (Samaras) with Comparative Remarks on Animal Flight” Biology Review 48 (1973), 561-96. Print. • www.exactmetrology.com/*Special Acknowledgement to Exact Metrology for scanning images • http://www.compadre.org/informal/features/featureSummary.cfm?FID=1227 • http://preachrr.wordpress.com/2011/04/07/maple-seed-design-really-%E2%80%9Ctakes-off%E2%80%9D/ • http://apps.carleton.edu/campus/facilities/sustainability/wind_turbine/