Download
1 / 6
60 likes | 223 Views
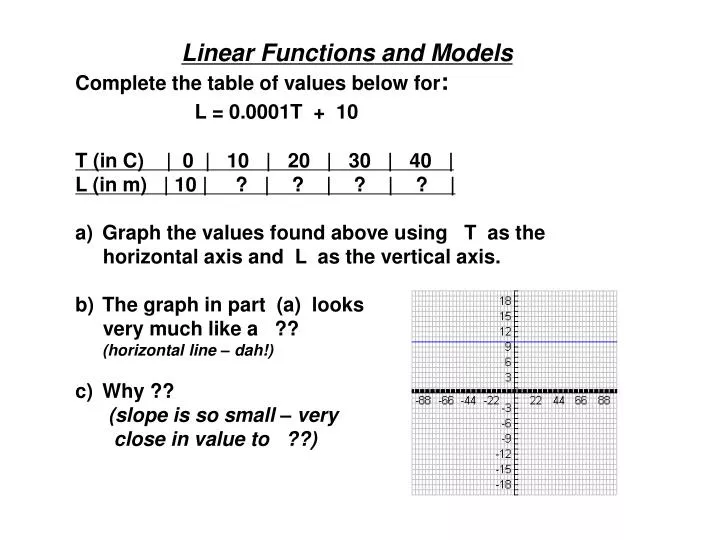
Linear Functions and Models Complete the table of values below for : L = 0.0001T + 10 T (in C) | 0 | 10 | 20 | 30 | 40 | L (in m) | 10 | ? | ? | ? | ? | Graph the values found above using T as the

E N D
Linear Functions and Models • Complete the table of values below for: • L = 0.0001T + 10 • T (in C) | 0 | 10 | 20 | 30 | 40 | • L (in m) | 10 | ? | ? | ? | ? | • Graph the values found above using T as the • horizontal axis and L as the vertical axis. • The graph in part (a) looks • very much like a ?? • (horizontal line – dah!) • Why ?? • (slope is so small – very • close in value to ??)
A function: -- describes a dependent relationship between quantities. For example the expression 3x – 5 depends on the value of ‘x’, so we say that ‘3x – 5’ is a function of ‘x’. In function notation we write: f(x) = 3x – 5 (normal notation reads as: y = 3x - 5 f(x) is read ‘f’ of ‘x’ Normal notation: states that y = 3x – 5, so this allows us to say that ‘y = f(x)’ In function notation, if f(x) = 3x – 5, then f(1) = ?? 3(1) – 5 or f(1) = - 2 So when x = 1, f(x) (which is another name for ‘y’) = - 2 so we basically come up with (1,-2)
If f(a) = 0, then whenever x = a, this makes the function = 0. • which gives the point (a,0); therefore ‘a’ is called a zero • of the function. • Other examples of linear functions and their meaning: • L(t) = 0.0001T + 10 ‘L’ is a linear function of ‘T’ • g(s) = -1.2s + 4.7 ‘g’ is a linear function of ‘s’ • h(t) = 3 ‘h’ is a linear function of ‘t’ • Examples: What is the slope of the graph of • f(x) = -2x + 4 ? • ?? - 2 • a) What is a ‘zero’ of the function? • Set -2x + 4 = 0 and solve for x • What are the intercepts of the functions graph? • y-intercept is 4 and x-intercept is 2 same value as the zero! • Find f(3/2) • Replace (3/2) in for ‘x’ and simplify to find f(x) or ‘y’
Example: Let ‘g’ be a linear function such that • g(1) = 2, and g(5) = 4 • Sketch the graph of ‘g’ • plot the ordered pairs (1,2) & (5,4) • b) Find an equation for ‘g(x)’ • Find the slope then use point-slope form) • c) Find g(-1) • Replace -1 in for ‘x’ in to your newly found • equation • Example: The senior class has paid $200 to rent • a roller skating rink for a fund raising party. • Tickets are $5 each. • Express the ‘net income’ as a • function of the number of • tickets sold • Let ‘x’ = Number of tickets sold. $200 –> is it + or - • Graph the function and identify • the point at which the class • begins to make a profit. • This would be the ‘zero’ or ‘x’-intercept!
Example: Suppose that is costs 50 cents for the first minute of a long distance telephone call and 20 cents for each additional minute or fraction thereof. Give a graphical model of the cost of a call lasting ‘t’ minutes. 1st: Lets analyze the information: time ‘t’ cost If 0 < t < 1 ?? If 1 < t < 2 ?? If 2 < t < 3 ?? If 3 < t < 4 ?? This type of problem actually models what is called a ‘step function’. Can you figure out why?
We could arrive at a ‘linear model’ to represent this situation. Would you say that ‘cost’ is a function of ‘time’, Or ‘time’ is a function of ‘cost’? ?? C(t) = 50 + 20t The problem with the algebraic model is that at times It may ‘over’ or ‘under’ estimate the cost. Talk about ‘domain’: the set of all ‘input’ values or ‘x’s and ‘range’: the set of all ‘outcomes’ or ‘y’s.