Download
1 / 281
3.06k likes | 3.91k Views
Content Quality Control charts Process capability Acceptance sampling. Reliability Quality costs product liability Quality systems Benchmarking and auditing. STATISTICAL QUALITY CONTROL AND DESIGN. COURSE INTRODUCTION. Text (Donna C.S. Summers, 3rd Edition)

E N D
Content Quality Control charts Process capability Acceptance sampling Reliability Quality costs product liability Quality systems Benchmarking and auditing STATISTICAL QUALITY CONTROL AND DESIGN
COURSE INTRODUCTION • Text (Donna C.S. Summers, 3rd Edition) • Website: overheads, assignments, solutions, computer lab documents, midterm and exam information, and other announcements and information • Lecture Notes (purchase or download) • Computer Lab • Background material: probability, statistical tests • Grading • Assignments • Midterm • Comprehensive Final
A WORD ABOUT CONDUCT • Basic principles 1. Every student has the right to learn as well as responsibility not to deprive others of their right to learn. 2. Every student is accountable for his or her own actions.
In order for you to get the most out of this class, please consider the following: a. Attend all scheduled classes and arrive on time. Late arrivals and early departures are very disruptive and violate the first basic principle. b. Please do not schedule other activities during this class time. I will try to make class as interesting and informative as possible, but I can’t learn the material for you. c. Please let me know immediately if you have a problem that is preventing you from performing satisfactorily in this class.
CHAPTER 1: QUALITY BASICS Outline • Definitions of quality • The evolution of quality • Inspection, quality control, statistical quality control, statistical process control, total quality management • Processes, variation, specification and tolerance limits
Quality and Education Business has made progress toward quality over the past several years. But I don’t believe we can truly make quality a way of life … until we make quality a part of every student’s education Edwin Artzt, Chairman and CEO, Proctor & Gamble Co., Quality Progress, October 1992, p. 25
Quality and Competitive Advantage • Better price • The better customers judge the quality of a product, the more they will pay for it • Lower production cost • It is cheaper to do a job right the first time than do it over • Faster response • A company with quality processes for handling orders, producing products, and delivering them can provide fast response to customer requests
Quality and Competitive Advantage • Reduced Inventory • When the production line runs smoothly with predictable results, inventory levels can be reduced • Improved competitive position in the marketplace • A customer who is satisfied with quality will tell 8 people about it; a dissatisfied customer will tell 22 (A.V. Feigenbaum, Quality Progress, February 1986, p. 27)
Customer-Driven Definitions of Quality • Conformance to specifications • Conformance to advertised level of performance • Value • How well the purpose is served at a particular price. • For example, if a $2.00 plastic ballpoint pen lasts for six months, one may feel that the purchase was worth the price.
Customer-Driven Definitions of Quality • Fitness for use • Mechanical feature of a product, convenience of a service, appearance, style, durability, reliability, craftsmanship, serviceability • Performance • The ability to satisfy the stated or implied need, operate without deficiencies and faults
Customer-Driven Definitions of Quality • Support • Financial statements, warranty claims, advertising • Psychological Impressions • Atmosphere, image, aesthetics • “Thanks for shopping at Wal-Mart”
The Evolution of Quality • Interchangeable parts (Eli Whitney, 1798) • Standardized production • Inspection • Measuring, examining, testing, or gauginf of one or more characteristics of a product or service • Determining if the product or service conforms to the established standards
The Evolution of Quality • Quality control • Establishing standards • Ensuring conformance to the standards • Corrective measures • Preventive measures
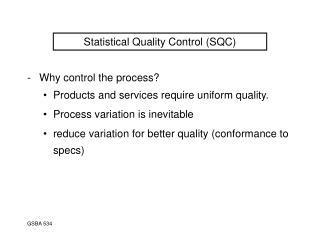
The Evolution of Quality • Statistical quality control • Shewart control chart uses the concepts of statistics to detect systematic problems that must be fixed in order to prevent the production of a large number of defective items • Acceptance sampling eliminates the need for 100% inspection
The Evolution of Quality • Statistical process control (SPC) • The costs are low if the problems are detected early • If a large number of defective products are produced, the scrap or rework costs can be high. • Prevention of defects by applying statistical methods to control the process is known as SPC • Prevention refers to those activities designed to prevent defects, defectives, and nonconformance in products and services
Cost of detection (dollars) Process Final testing Customer When defect is detected Costs of Detecting Defects
The Evolution of Quality • Total quality management (TQM) • A management approach that places emphasis on continuous process or system improvement • Based on the participation of all members of an organization to continuously improve the processes • Utilizes the strengths and expertise of all the employees as well as the statistical problem-solving and charting methods of SPC
TQMWheel Customer satisfaction
Reading • Chapter 1: • Reading pp. 2-17 (2nd ed.), pp. 2-21 (3rd ed.)
CHAPTER 3: QUALITY IMPROVEMENT Outline • Process improvement • PDSA cycle • Process improvement steps • Tools
The P-D-S-A Cycle Plan Identify problem. Develop plan for improvement. Do Act Institutionalize improvement. Continue cycle. Implement plan on test basis Study Is the plan working?
Steps in Process Improvement • Plan 1: Recognize problem 2: Form quality improvement teams 3: Define problem 4: Develop performance measures 5: Analyze problem 6: Determine possible causes
Steps in Process Improvement • Do 7: Implement solution • Study 8: Evaluate solution • Act 9: Ensure performance 10: Continuous improvement
Plan: Steps 1 and 2 1: Recognize problem • Existence of the problem is outlined • In general terms, specifics are not clearly defined • Solvability and availability of resources are determined 2: Form quality improvement teams • Interdisciplinary • Specified time frame • Quality circle
Plan: Step 3 3: Define the problem • Define the problem and its scope • Pareto analysis • Brainstorming • Why-why diagram
50 40 30 20 10 0 100 80 60 40 20 0 Cumulative percentage Number of defects Pareto Chart
50 40 30 20 10 0 100 80 60 40 20 0 C Cumulative percentage Number of defects D A B Defect type Pareto Chart
50 40 30 20 10 0 100 80 60 40 20 0 C Cumulative percentage Number of defects D A B Defect type Pareto Chart
70 60 50 40 30 20 10 0 Pareto Chart (64) Percent from each cause (13) (10) (6) (3) (2) (2) Poor Design Defective parts Operator errors Machine calibrations Defective materials Surface abrasions Wrong dimensions Causes of poor quality
Why-Why Diagram • A technique to understand the problem • Does not locate a solution • The process leads to many reasons the original problem occurred • Example: A mail-order company has a goal or reducing the amount of time a customer has to wait in order to place an order. Create a why-why diagram about waiting on the telephone.
Why-Why Diagram Workers not scheduled at peak times Why? Waiting on the phone to place an order Insufficient operators available Why? Why? Low pay Many customers calling at the same time All catalogs shipped at the same time Why? Why?
Plan: Step 4 4: Develop performance measures • Set some measurable goals which will indicate solution of the problem • Some financial measures: costs, return on investment, value added, asset utilization • Some customer-oriented measures: response times, delivery times, product or service functionality, price • Some organization-oriented measures: employee retention, productivity, information system capabilities
Plan: Steps 5 and 6 5: Analyze problem • List all the steps involved in the existing process and identify potential constraints and opportunities of improvement • Flowchart 6: Determine possible causes • Determines potential causes of the problem • Cause and effect diagrams, check sheets, histograms, scatter diagrams, control charts, run charts
Flowchart Operation Storage Inspection Delay Transportation Decision
Enter emergency room Flowchart Fill out patient history Nurse inspects injury Return to waiting room Walk to triage room Wait for ER bed Walk to ER bed Doctor inspects injury Wait for doctor Walk to Radiology
Walk to radiology Flowchart Technician X-rays patient Doctor provides diagnosis Wait for doctor to return Return to ER bed Return to Waiting Leave Building Walk to pharmacy Pickup prescription Checkout
Cause and Effect Diagram • Common categories of problems in manufacturing • 5 M’s and an E • Machines, methods, materials, men/women, measurement and environment • Common categories of problems in service • 3 P’s and an E • Procedures, policies, people and equipment
Cause and Effect Diagram Measurement Men/Women Machines Out of adjustment Poor supervision Faulty testing equipment Lack of concentration Tooling problems Incorrect specifications Improper methods Old / worn Inadequate training Quality Problem Inaccurate temperature control Poor process design Defective from vendor Ineffective quality management Not to specifications Dust and Dirt Material- handling problems Deficiencies in product design Environment Materials Methods
COMPONENTS REPLACED BY LAB TIME PERIOD: 22 Feb to 27 Feb 1998 REPAIR TECHNICIAN: Bob TV SET MODEL 1013 Integrated Circuits|||| Capacitors |||| |||| |||| |||| |||| || Resistors || Transformers|||| Commands CRT | Check Sheet
40 35 30 25 20 15 10 5 0 1 2 6 13 10 16 19 17 12 16 20 17 13 5 6 2 1 Histogram Frequency of calls Telephone call duration, min
Scatter Diagram . Number of tears Rotor speed, rpm
Control Chart 27 24 UCL = 23.35 21 c = 12.67 18 15 Number of defects 12 9 6 LCL = 1.99 3 2 4 6 8 10 12 14 16 Sample number
Do: Step 7 7: Implement the solution • The solution should • prevent a recurrence of the problem • address the root cause of the problem • be cost effective • be implemented within a reasonable amount of time • Force-field analysis
Do: Step 7 • Force-field analysis • A chart that lists • the positive or driving forces that encourages improvement as well as • the restraining forces that hinders improvement • Actions necessary for improvement
Do: Step 7 Example: create a force-field diagram for the following problem: • Bicycles are being stolen at a local campus. Campus security is considering changes in the bike rack design, bike parking restrictions and bike registration to try to reduce thefts. Thieves have been using hacksaws and bolt cutters to remove locks from the bikes
Reading • Chapter 3: • Reading pp. 64-97 (2nd ed.), pp. 52-102 (3rd ed.)
CHAPTER 5: VARIABLE CONTROL CHARTS Outline • Construction of variable control charts • Some statistical tests • Economic design
Control Charts • Take periodic samples from a process • Plot the sample points on a control chart • Determine if the process is within limits • Correct the process before defects occur
Types of Data • Variable data • Product characteristic that can be measured • Length, size, weight, height, time, velocity • Attribute data • Product characteristic evaluated with a discrete choice • Good/bad, yes/no
Upper control limit Process average Lower control limit 10 9 1 2 3 4 5 6 7 8 Process Control Chart Sample number