Download
1 / 5
100 likes | 420 Views
Example The table below lists the heights (in cm) and the shoe sizes of 12 people (all female). Scatter Diagrams. Represent the data on a scatter diagram. Example The table below shows the marks obtained by 12 pupils in a French examination and a History examination.

E N D
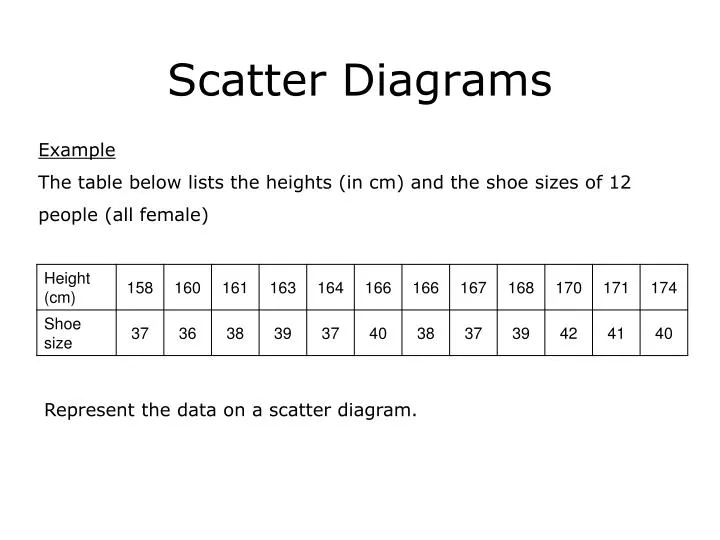
Example The table below lists the heights (in cm) and the shoe sizes of 12 people (all female) Scatter Diagrams Represent the data on a scatter diagram.
Example The table below shows the marks obtained by 12 pupils in a French examination and a History examination. Draw a scatter diagram to represent these results and draw on a line of best fit. Adam scored 60% in his French exam but was absent for his History exam. What mark do you estimate for him?
Example Twelve ‘A’ level students recently took mock examinations in Maths. Here are their marks for the two papers • Draw a scatter diagram to represent these results and draw on a line of best fit. • A student M scored 50 marks on Paper 1 but was absent for paper 2. Use the line of best fit to predict a score for student M on paper2.
Example Ashish compared the published price of several children’s books with the price of the same books in a discount book club catalogue. a) Represent this information on a scatter diagram b) Draw on a line of best fit c) If a book has a published price of £12.50, what is the price of the same book likely to be in the catalogue?