Download
1 / 1
10 likes | 202 Views
10 -6. 2 x 10 -5. *. *. 9 x 10 -6. 2 x 10 -3. *. *. 10 -6. *. 4.5 x 10 -3. *. One Locus. Two Locus. Three Locus. Four Locus. Genes. MMP9. BCL2/CYP2D6. XPC/XRCC3/BCL2. XPC/BRCA2/XRCC3/BCL2. SNPs. rs2250889. rs1811018 rs1800071r. Rs2228001 rs861539/1801018.

E N D
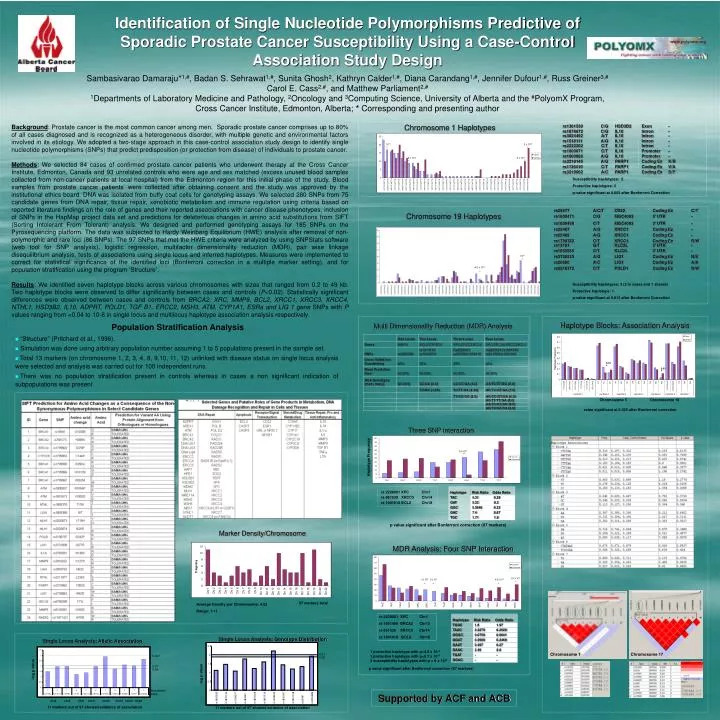
10-6 2 x 10⁻⁵ * * 9 x 10⁻⁶ 2 x 10⁻³ * * 10-6 * 4.5 x 10-3 * One Locus Two Locus Three Locus Four Locus Genes MMP9 BCL2/CYP2D6 XPC/XRCC3/BCL2 XPC/BRCA2/XRCC3/BCL2 SNPs rs2250889 rs1811018 rs1800071r Rs2228001 rs861539/1801018 rs2228001/rs1801406 rs861539/rs1801018 Cross Validation Consistency 60% 20% 30% 40% Mean Prediction Error 50.20% 46.90% 46.90% 49.35% Risk Genotypes (Odds Ratio) CC (3.0) CC/GA (2.0) CC/GT/GA (4.5) AA/TC/TT/GG (8.0) TC/GG (1.86) TC/TT/GA (4.33) AG/TC/GT/GA (7.0) TT/GG/GG (3.0) AG/CC/GT/GA (5.0) AG/TT/TT/GA (4.0) AA/TC/GT/GG (3.0) AG/TC/GT/AA (3.0) Haplotype Risk Ratio Odds Ratio TAC 0.31 0.28 GAT 0.33 0.3 GGC 0.3646 0.33 GAC 7.4 8.67 TGC 1.71 1.9 rs 2228001 XPC Chr1 rs 861539 XRCC3 Chr14 rs 1801018 BCL2 Chr18 Identification of Single Nucleotide Polymorphisms Predictive of Sporadic Prostate Cancer Susceptibility Using a Case-Control Association Study Design www.polyomx.org Sambasivarao Damaraju*1,#, Badan S. Sehrawat1,#, Sunita Ghosh2, Kathryn Calder1,#, Diana Carandang1,#, Jennifer Dufour1,#, Russ Greiner3,# Carol E. Cass2,#, and Matthew Parliament2,# 1Departments of Laboratory Medicine and Pathology, 2Oncology and 3Computing Science, University of Alberta and the #PolyomX Program, Cross Cancer Institute, Edmonton, Alberta; * Corresponding and presenting author Background: Prostate cancer is the most common cancer among men. Sporadic prostate cancer comprises up to 80% of all cases diagnosed and is recognized as a heterogeneous disorder, with multiple genetic and environmental factors involved in its etiology. We adopted a two-stage approach in this case-control association study design to identify single nucleotide polymorphisms (SNPs) that predict predisposition (or protection from disease) of individuals to prostate cancer. Methods: We selected 84 cases of confirmed prostate cancer patients who underwent therapy at the Cross Cancer Institute, Edmonton, Canada and 93 unrelated controls who were age and sex matched (excess unused blood samples collected from non-cancer patients at local hospital) from the Edmonton region for this initial phase of the study. Blood samples from prostate cancer patients’ were collected after obtaining consent and the study was approved by the institutional ethics board. DNA was isolated from buffy coat cells for genotyping assays. We selected 280 SNPs from 75 candidate genes from DNA repair, tissue repair, xenobiotic metabolism and immune regulation using criteria based on reported literature findings on the role of genes and their reported associations with cancer disease phenotypes, inclusion of SNPs in the HapMap project data set and predictions for deleterious changes in amino acid substitutions from SIFT (Sorting Intolerant From Tolerant) analysis. We designed and performed genotyping assays for 185 SNPs on the Pyrosequencing platform. The data was subjected to Hardy Weinberg Equilibrium (HWE) analysis after removal of non-polymorphic and rare loci (86 SNPs). The 97 SNPs that met the HWE criteria were analyzed by using SNPStats software (web tool for SNP analysis), logistic regression, multifactor dimensionality reduction (MDR), pair wise linkage disequilibrium analysis, tests of associations using single locus and inferred haplotypes. Measures were implemented to correct for statistical significance of the identified loci (Bonferroni correction in a multiple marker setting), and for population stratification using the program ‘Structure’. Results: We identified seven haplotype blocks across various chromosomes with sizes that ranged from 0.2 to 49 kb. Two haplotype blocks were observed to differ significantly between cases and controls (P<0.02). Statistically significant differences were observed between cases and controls from BRCA2, XRC, MMP9, BCL2, XRCC1, XRCC3, XRCC4, NTHL1, HSD3B2, IL10, ADPRT, POLD1, TGF B1, ERCC2, MSH3, ATM, CYP1A1, ESRa and LIG 1 gene SNPswith P values ranging from <0.04 to 10-8 in single locus and multilocus haplotype association analysis respectively. Chromosome 1 Haplotypes Susceptibility haplotypes: 2 Protective haplotypes: 2 p-value significant at 0.005 after Bonferroni Correction Chromosome 19 Haplotypes Susceptibility haplotypes: 3 (2 in cases and 1 shared) Protective haplotype: 1 p-value significant at 0.013 after Bonferroni Correction Population Stratification Analysis • “Structure” (Pritchard et al., 1998). • Simulation was done using arbitrary population number assuming 1 to 5 populations present in the sample set. • Total 13 markers (on chromosome 1, 2, 3, 4, 8, 9,10, 11, 12) unlinked with disease status on single locus analysis were selected and analysis was carried out for 100 independent runs. • There was no population stratification present in controls whereas in cases a non significant indication of subpopulations was present Haplotype Blocks: Association Analysis Multi Dimensionality Reduction (MDR) Analysis 0.01 * 0.01 * Chromosome 5 Chromosome 16 value significant at 0.025 after Bonferroni correction Three SNP interaction 3.5 x10⁻⁶ ** Haplotype Frequency p value significant after Bonferroni correction (97 markers) Marker Density/Chromosome MDR Analysis: Four SNP Interaction 8.7 x 10⁻⁷ 5 x 10⁻⁸ 6 x 10⁻⁸ 4.5 x 10⁻⁴ * * * * 97 markers total Average Density per Chromosome: 4.62 Range: 1-11 rs 2228001 XPC Chr1 rs 1801406 BRCA2 Chr13 rs 861539 XRCC3 Chr14 rs 1801018 BCL2 Chr18 Haplotype Risk Ratio Odds Ratio TGGC 1.8 1.97 TAAC 0.2278 0.2026 GGGC 0.0759 0.0641 Single Locus Analysis: Genotype Distribution GGAT 0.2988 0.2469 Single Locus Analysis: Allelic Association GAAT 0.297 0.27 2.5 GAAC 2.39 2.6 1 protective haplotype with p<4.5 x 10⁻⁴ 1 protective haplotype with p<8.7 x 10⁻⁷ 2 susceptibility haplotypes with p < 6 x 10⁻⁸ 3.5 Chromosome 1 Chromosome 17 0.01 TGAT - - 2 0.001 3 0.05 GGAC - - 2.5 1.5 0.01 2 -log p value p value significant after Bonferroni correction (97 markers) 0.05 1.5 1 log p value 1 0.5 0.5 - 0 Associated 0 T C T G C A T G G T C Supported by ACF and ACB Allele rs3731062 rs1870134 rs184967 rs6195 rs1801132 rs1801516 rs1048943 rs1799814 rs1800067 rs25487 rs2250889 rs1800935 rs1870134 rs1799977 rs1805329 rs1801516 rs1048943 rs1800067 rs1801018 rs2250889 rs184967 rs25487 Chr 3 Chr 5 Chr 6 Chr 11 Chr 15 Chr 16 Chr 19 Chr 20 11 markers out of 97 showed evidence of association 11 markers out of 97 showed evidence of association