Download
1 / 18
180 likes | 263 Views
Data Analysis Concepts & Terms. Concepts. Data Analysis Concepts & Terms. Triangulation Data Analysis Terms & Techniques Data Sources. Triangulation. What is it ? Why is it important?. Triangulation: A Multidimensional View. Triangulation. What is it?

E N D
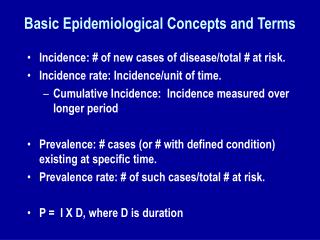
Data Analysis Concepts & Terms Concepts
Data AnalysisConcepts & Terms • Triangulation • Data Analysis Terms & Techniques • Data Sources
Triangulation • What is it? • Why is it important?
Triangulation: A Multidimensional View Triangulation • What is it? • Using multiple data sources, data collection procedures, and analytic procedures. • Why is it important? • It can ensure a more accurate view that will help in making more effective decisions.
Data Analysis Model and Process When using a process to analyze data it is important to practice a multidimensional view. Triangulation Triangulation: A Multidimensional View
Data Analysis Techniques to Review: Examples of Data Analysis Techniques • Collecting and reviewing baseline data • Discuss / define student data points • Disaggregating student data and digging deeper • The Data Analysis Model and Process • Graphing and visually displaying data to share with teachers, campuses and district staff
Examples of Data Analysis Techniques Baseline Data: Facts / Characteristics Definition Initial student (assessment) information and data that is collected prior to program interventions and activities. • It can be used later to provide a comparison for assessing the interventions impact / success. • Usually collected at the: • BOY, MOY, EOY. Examples Non-examples Baseline data Data: Readiness Inventories, ACP Tests, ISIP, ITBS, Fluency Probes, Texas Middle School Fluency Assessment (TMSFA), TAKS. • Unspecific or • non-measurable item.
Examples of Data Analysis Techniques Student Data Point: Definition Facts / Characteristics A data point is one score on a graph or chart, which represents a student’s performance at one point in time. Can be collected at different intervals (daily, weekly, monthly). Can be plotted on a graphical display. Trends and patterns can be observed. Examples Non-examples Student data point • Unspecific or • non-measurable item.
Disaggregating student data and digging deeper: Examples of Data Analysis Techniques • Disaggregating data involves separating student-learning data results into groups of data sets by race/ethnicity, language, economic level, and or educational status. • Normally student achievement data are reported for whole populations, or as aggregate data. When data is disaggregated, patterns, trends and other important information are uncovered.
Examples of Data Analysis Techniques • Why is it important? • By looking at data by classrooms in a school, by grade levels within a school or district, or by schools within in a district; disaggregated data can tell you more specifically what is affecting student performance. Disaggregating student data and digging deeper:
Examples of Data Analysis Techniques • Why is it important? • Disaggregators allow the ability to focus in on a particular group of students and to compare them with a reference group. • For example, a campus may want to see how the Limited English Proficient (LEP) students are performing relative to other students. Disaggregating student data and digging deeper:
Examples of Data Analysis Techniques Disaggregators can include the following: • Race • Ethnicity • Gender • Special Education Status • Lunch Status (Income Level) • English Proficiency (LEP) • Grade • Attendance Rates • Retention • Current and Prior Programs, Supports, and Interventions Example: • Fourth-grade African American, White, Hispanic, Native American, and Asian students’ performance in math.
Examples of Data Analysis Techniques Practice a consistent process to analyze data such as: The Data Analysis Model and Process
Examples of Data Analysis Techniques Further information over The Data Analysis Model and Process, tools and resources can be found at: http://www.dallasisd.org/Page/12258
Graphing and visually displaying data to share with teachers, campuses and district staff Examples of Data Analysis Techniques • Data Walls can: • Create visual displays of data, and student / teacher progress toward goals • Build a shared vision of campus and teacher ownership and awareness toward goals
Graphing and visually displaying data to share with teachers, campuses and district staff Examples of Data Analysis Techniques • Data Walls can: • Facilitate team engagement and learning • Create visuals that anchor teachers and campuses work and can be shared with other audiences
Student Data Specific Examples of Student Data: Data Sources • Assessments • Academic Behavior • On-Track /Graduation • College Readiness • Course Enrollment • Demographics • Elementary (PK-5): • ISIP, ITBS/Logramos, STAAR, TAKS, Readiness Inventory, Interim Assessments • Secondary (6-12): • Readiness Inventory, Interim Assessment, Writing Assessment, ACP, TAKS/STAAR, Texas Middle School Fluency Assessment (TMSFA), Fast ForWord Reading Progress Indicator (RPI), EOC, Readistep, PSAT
Examples of Campus Data & Locations: Data Sources • AEIS – Academic Excellence Indicator System : http://ritter.tea.state.tx.us/perfreport/aeis/ • AYP – Adequate Yearly Progress : http://www.tea.state.tx.us/ayp/ • District performance standards and campus information found in Dallas ISD Campus Data Packets: http://mydata.dallasisd.org/SL/SD/cdp.jsp