Download

1 / 51
510 likes | 577 Views
Learn about discrete random variables, probability distributions, mean, variance, and standard deviation calculations using statistical tools like Excel or a TI-83/84 calculator. Explore how to identify unusual results and work with uniform probability distributions.

E N D
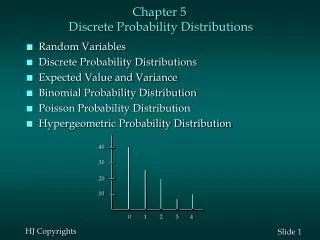
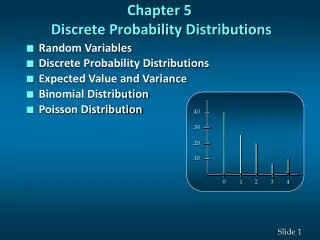
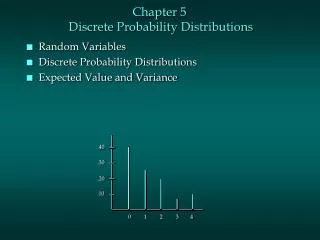
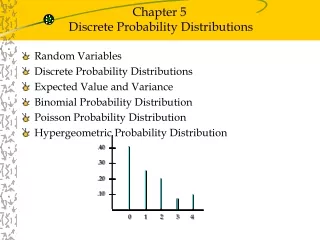
Discrete Distributions Chapter 5
Random variablea variable (typically represented by x) that takes a numerical value by chance. For each outcome of a procedure, x takes a certain value, but for different outcomes that value may be different. pg. 205 Random Variables
Examples: • Number of boys in a randomly selected family with three children. • Possible values: x=0,1,2,3 • The weight of a randomly selected person from a population. • Possible values: positive numbers, x>0
Examples: • Genetics: If two pea plants have both green and yellow pod genes, the probability that offspring pea plants has a green pod is .75 • That is • P(green) = .75
Discrete random variableEither a finite number of values or countable number of values (resulting from a counting process) Discrete and Continuous Random Variables • Continuous random variableInfinitely many values, and those values can be associated with measurements on a continuous scale without gaps or interruptions • pg. 206
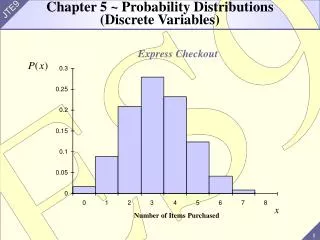
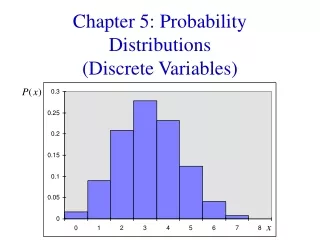
Probability Distributions • Probability distributionA description that gives the probability for each value of the random variable; often expressed in the format of a table, graph, or formula • Pea pod histogram on page 207
Tables Values: Probabilities:
Graphs The probability histogram is very similar to a relative frequency histogram, but the vertical scale shows probabilities.
Requirements for Probability Distribution ∑ P(x) = 1 where x assumes all possible values. • 0 P(x) 1 • for every individual value of x. • pg. 207
µ = ∑[x•P(x)]Mean σ 2 = ∑ [(x –µ)2 • P(x)] Variance σ 2= ∑[x2 • P(x)] – µ2Variance (shortcut) σ = ∑[x 2 • P(x)] –µ2Standard Deviation Mean, Variance and Standard Deviation of a Probability Distribution
Using TI-83/84 calculator • Press the STAT button and choose EDIT • Enter the x-values into the list L1 and the P(x) values into the list L2 • Press the STAT button and choose CALC • Choose 1-Var Stats and press ENTER • Type in L1 then , (comma) then L2 on that line, you will see 1-Var Stats L1,L2 • Press ENTER • You will see x-bar=…, it is actually m (mean) and sx=…, it is actually s (st. deviation)
Finding the Mean, Variance, and Standard Deviation Example 5, page 209 Table 5-1 describes the probability distribution for the number of peas with green pods among five offspring peas obtained from parents both having the green/yellow pair of genes.
Using Excel - Mean • Put the x-values in column 1 • Put the P(x)-values in column 2 • In column 3 enter “=A1*B1” • Copy and paste that cell to the entire column of data • At the bottom of column 3 enter “=sum(c1:cN)” - N is the last row of the data Table 5-3, pg 209
Using Excel – Standard Deviation Continuing • In column 4 enter “=power(A1-$c$M,2)*B1” • Copy and paste that cell to the entire column of data • At the bottom of column 4 enter “=sum(d1:dN)” - N is the last row of the data
Using Excel to find the mean and standard deviation of a discrete probability distribution More detailed example
Using Excel to find the mean and standard deviation of a discrete probability distribution (1) Enter the values and their probabilities as separate columns
Using Excel (continued) (2) Check to make sure the values of P(x) add up to 1:
Using Excel (continued) (3) In column C, for each value of x, calculate x*P(x):
Using Excel (continued) (4) The sum of column C will give the value of the mean, μ
Using Excel (continued) (5) In column D, calculate the values of X2*P(x)
Using Excel (continued) (6) Calculate the sum of the squares times probability - X2*P(x)
Using Excel (continued) (7) Use the shortcut formula for the variance:
Using Excel (continued) (8) Finally, the Standard deviation is just the square root of the variance:
How to Choose Lottery Numbers • Note the sidebar on page 209 about choosing numbers in a lottery.
Round results by carrying one more decimal place than the number of decimal places used for the random variable x. If the values of xare integers, round µ,σ, andσ2 to one decimal place. Pg 210 Roundoff Rule for µ,σ, andσ2
Identifying Unusual Results Range Rule of Thumb According to the range rule of thumb, most values should lie within 2 standard deviations of the mean. We can therefore identify “unusual” values by determining if they lie outside these limits: Maximum usual value = μ + 2σ Minimum usual value = μ – 2σ
Identifying Unusual Results By Probabilities Using Probabilities to Determine When Results Are Unusual: • Unusually high: a particular value x is unusually high if P(xor more) ≤ 0.05. • Unusually low: a particular value x is unusually low if P(xor fewer) ≤ 0.05.
Uniform Probability Distribution A uniform probability distributionhas the following property: P(x) = c The value c is a constant, so every event is just a likely as every other event. If there are n events P(x) = 1n
Binomial Probability Distribution A binomial probability distribution results from a procedure that meets all the following requirements: 1. The procedure has a fixed number of trials. 2. The trials must be independent. (The outcome of any individual trial doesn’t affect the probabilities in the other trials.) 3. Each trial must have all outcomes classified into twocategories (commonly referred to as success and failure). 4. The probability of a success remains the same in all trials. pp 218-219
Notation for Binomial Probability Distributions S and F (success and failure) denote the two possible categories of all outcomes; p and q denote the probabilities of S and F, respectively: P(S) = p (p = probability of success) P(F) = 1 – p = q (q = probability of failure) Note that “success” may not be desirable.
Notation (continued) n denotes the fixed number of trials. x denotes a specific number of successes in n trials, so x can be any whole number between 0 and n, inclusive. p denotes the probability of success in one of the ntrials. q denotes the probability of failure in one of the n trials. P(x) denotes the probability of getting exactly x successes among the n trials. pg 219
Methods for Finding Probabilities We will now discuss three methods for finding the probabilities corresponding to the random variable x in a binomial distribution.
n! P(x) = •px•qn-x (n –x )!x! for x = 0, 1, 2, . . ., n Method 1: Using the Binomial Probability Formula where n = number of trials x = number of successes among n trials p = probability of success in any one trial q = probability of failure in any one trial (q = 1 – p) pg 221
n! P(x) = •px•qn-x (n –x )!x! The number of outcomes with exactly x successes among n trials Rationale for the Binomial Probability Formula
n! P(x) = •px•qn-x (n –x )!x! The probability of x successes among n trials for any one particular order Number of outcomes with exactly x successes among n trials Binomial Probability Formula
Method 2: Using TI-83/84 • Press 2nd VARS to get the DISTR menu • Scroll down to binomialpdf( and press ENTER • Type in three values: n, p, x (separated by commas) and close the parenthesis • You see a line like binomialpdf(10,.3,6) • Press ENTER and read the probability of the value x (successes)in n trials
Alternative use of TI-83/84 • Press 2nd VARS to get the DISTR menu • Scroll down to binomialcdf( and press ENTER • Type in three values: n, p, x (separated by commas) and close the parenthesis • You see a line like binomialcdf(10,.3,6) • Press ENTER and read the combined probability of all values from 0 to x (i.e., probability that there are at most x successes)
Method 3: Excel • Use an Excel canned function
Using Excel (2007 or later) for Binomial Distributions (1) With the cell you want highlighted, From the home tab, click the arrow beside the ∑ button, and select “more functions”
Using Excel (2007 or later) for Binomial Distributions (2) In the pop-up window, scroll down and select the category “statistical”
Using Excel (2007 or later) for Binomial Distributions (3) Under “select a function” scroll down to BINOMDIST and click “ok”
Using Excel (2007 or later) for Binomial Distributions (4) Fill in the values required Number_s # of successes Trials # of trials Probability_s probability of success Cumulative TRUE if you want the probability of x or fewer successes, FALSE if you just want the probability of exactly x successes.
Using Excel (2007 or later) for Binomial Distributions (5) Now look back at the cell you had highlighted: From now on, you can just enter this short form if you find it quicker.
Example An “unfair coin” has a 0.55 probability of getting heads and is tossed 10 times • What is the probability of getting exactly 5 heads? • What is the probability of getting at least 4 heads?
Example Probability of heads: p = 0.55 Number of tosses: n = 10 “Exactly 5 heads” → P(5) P(5) = 0.234
Example Probability of heads: p = 0.55 Number of tosses: n = 10 “at most 4 heads” → ∑P(4) ∑P(4) = 0.262
Example An “unfair coin” has a 0.55 probability of getting heads and is tossed 10 times p = 0.55 n = 10 • What is the probability of getting exactly 5 heads? • What is the probability of getting at least 4 heads? P(5) = 0.234 ∑P(4) = 0.262
Mean µ = n • p Varianceσ2 = n • p • q Std. Dev. σ = n • p • q Binomial Distribution: Formulas Where n = number of fixed trials p = probability of success in one of the n trials q = probability of failure in one of the n trials