Download
1 / 15
150 likes | 249 Views
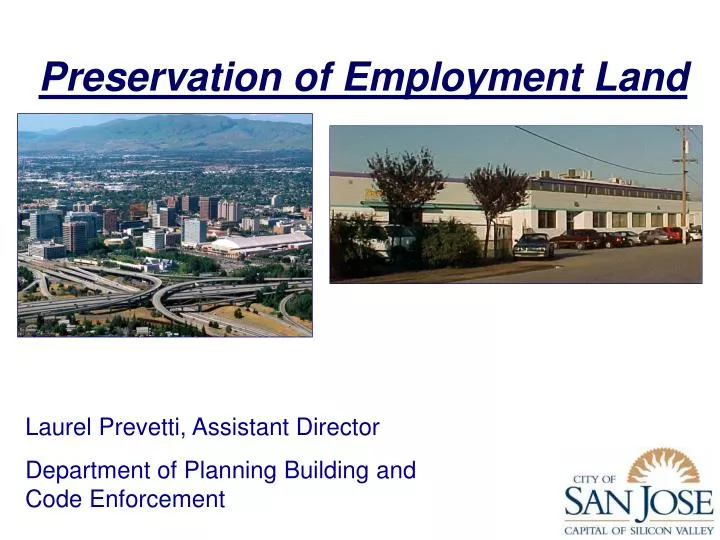
Item 4.5. Item # 4.5. Item: 4.5. Item 4.5. Preservation of Employment Land. Laurel Prevetti, Assistant Director Department of Planning Building and Code Enforcement. The Vital Cycle of San Jose’s Economy. Maintaining a Diverse Economy has been a Long Battle.

E N D
Item 4.5 Item # 4.5 Item: 4.5 Item 4.5 Preservation of Employment Land Laurel Prevetti, Assistant Director Department of Planning Building and Code Enforcement
Maintaining a Diverse Economy has been a Long Battle 1991: Industrial Supplier/Services Study 1994: General Plan Update 2000: Economic Base Study 2004: Towards the Future Study; First Employment Lands Framework 2007: Employment Preservation Framework
Alviso Berryessa 880 680 280 237 • Specific Plans • South Rincon Alum Rock • Japantown West Valley • Midtown • Tamien • Communications Hill Evergreen 101 Cambrian 87 Edenvale • Job Centers Almaden • North Coyote Coyote 85 • Edenvale • Evergreen Future Growth Locations • North San Jose • Downtown North San Jose • Transit-Oriented Development Corridors
San Jose has Sufficient Housing Planned: Existing General Plan includes 60,000+ Units* *Does not include potential units in Evergreen, Coyote Valley, or South Almaden Valley
San Jose’s Employment Lands • Definition: Non-residential designated land supporting private-sector employment • High Impact: Employment lands provide 60% of City Revenues • Limited Supply: Only 15% of City land is designated as employment land
Since 1990, San Jose has Converted 9%of all Employment Lands Total Converted Acreage 1,400 Acres of Employment Land Available Conversion rate nearly doubled in recent period: 1990-2000: 68.6 ac/yr 2001-2006: 119.7 ac/yr
San Jose has lost over 1,400 acres of Employment Land since 1990 Lost Job Capacity: 68,000-110,000 jobs 3,000 to 5,000 jobs 40,000 to 60,000 jobs 10,000 to 15,000 jobs 5,000 to 15,000 jobs 10,000 to 15,000 jobs
San Jose Remains the Valley’s Bedroom Community Progress lost in recent period: (San Jose Jobs per Employed Resident) Jobs per Employed Resident (2005) Average: 1.19 * Source ABAG Projections 2007
San Jose’s Revenue per Capita* Among Lowest in Region and State *General Fund Revenues (property, sales, utility taxes, etc) Source: Individual City Budgets FY 06/07
Surplus (1%) Surplus (2.5%) Balanced (0%) Balanced (0%) Deficit (-3.5%) Less Employment Land Equals Revenue Shortfalls Projected General Fund Budget Surplus/Deficit 2006-2007
Revenues from Various Land Uses **Employment lands generate significantly more revenue than residential uses (<55 Units/Acre)
Framework for the Preservation of Employment Lands (2007) • No Net Loss of Heavy and Light Industrial Acreage • Retain Citywide Job Capacity • Maintain Employment Lands for Non-Residential Uses
Framework for the Preservation of Employment Lands • Discourage Conversion in Key Employment Areas
Opportunities for Action • Link with “sustainability” objectives • Foster green businesses • Encourage a real mix of uses at transit • Facilitate regional solutions • Enhance political will