Download
1 / 28
290 likes | 444 Views
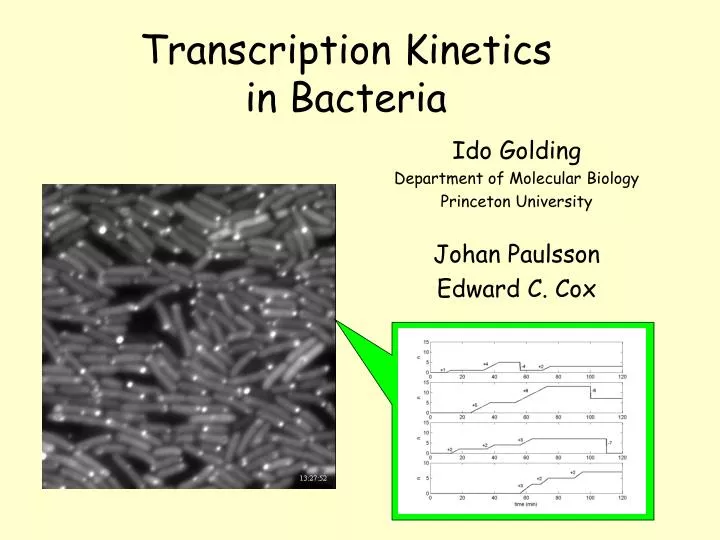
Transcription Kinetics in Bacteria. Ido Golding Department of Molecular Biology Princeton University Johan Paulsson Edward C. Cox. Cellular life as a set of discrete events. Transcription (initiation, elongation, termination) Translation RNA & protein degradation

E N D
Transcription Kinetics in Bacteria Ido Golding Department of Molecular Biology Princeton University Johan Paulsson Edward C. Cox
Cellular life as a set of discrete events • Transcription (initiation, elongation, termination) • Translation • RNA & protein degradation • Binding of transcription factors • DNA replication • Homologous recombination • … Aim: To Reliably detect and quantify the kinetics of these processes (Usually obscured by population averaging etc.) • What does it mean for a gene to be ‘on’ ? • Physical nature of the cytoplasm • Credo: What is needed in biology ?
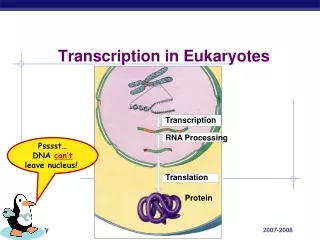
Gene expression in bacteria “The central dogma of molecular biology” DNA RNA PROTEIN transcription translation http://www- rohan.sdsu.edu/~jmahaffy/courses/s00/math121/lectures/func_review_quad/images/transcription.jpg Miller et al (1970)
Studying transcription: Two ends of the spectrum In vivo / Whole population: DNA microarrays Y. Chen cDNA RNA Real time PCR Cells In vitro / Single molecule: S. Zawilski Optical trapping setup for studying RNA polymerase J. Shaevitz et al, Nature426: 684 - 687 (2003) Record of RNA polymerase motion
IPTG, arabinose Following transcription in real-time RNA-tagging protein: MS2-GFP PLtetO-1 MS2d GFPmut3 aTc Gene of interest: Plac/ara mRFP1 96x MS2-bs RNA target RFP protein Golding et al, Cell (2005)
Gene-of-interest inactive : • No RNA target present • Uniform green fluorescence • (free MS2-GFP) • No RFP present
Gene-of-interest active : • RNA target present • Localized green fluorescence • (bound MS2-GFP) • RFP present
What can we measure? • Single molecule dynamics of mRNA: • Low mRNA levels: each “spot” = 1 mRNA molecule. • Chain elongation during transcription • Polymer fluctuations • Cytoplasmic motion Spot intensity ~ 70 GFPs Golding and Cox, PNAS (2004); Golding and Cox, Phys. Rev. Lett. (2006)
Histogram of RNA copy number: 1st peak = inter-peak interval 50-100 X GFP = 1 transcript Gene induction kinetics: Indicators of gene activity + additional tests QPCR: S. Zawilski Lux: Lutz & Bujard 1997 What can we measure? 2. mRNA & protein numbers: mRNA number of bound MS2-GFP proteins photon flux from localized green fluorescence Protein number of mRFP1 proteins photon flux from whole-cell red fluorescence
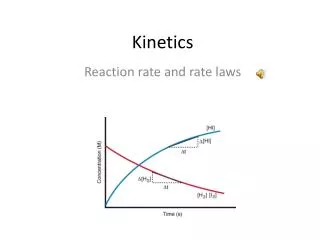
mRNA per cell Approach to steady state Induction kinetics: Population average Constant rate of production k1 ; first-order elimination with rate constant k2: dn/dt = k1 – k2n n(t) = k1 /k2 (1 – e - k2t) n(t) = mRNA/cell k1= transcription rate = 0.14 min-1 (fit) k2= dilution rate = ln 2 / 50 min-1 Average kinetics consistent with Poisson process.
Simulation mRNA copy-number histogram Induction kinetics: Population heterogeneity
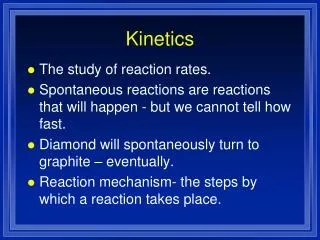
Variance vs mean Induction kinetics: Population heterogeneity Fraction of cells with no mRNA: P0(t) e-k1t k1 (measured) 0.03 min-1 rate of N0 decline << transcription rate! Probability of zero events Variance to mean ratio: Poisson:s2 / n = 1 measured:s2 / n 4 Inconsistent with Poisson process!
Transcription as a “2-state process” Gene in the OFF state switches ON with a constant probability (k1). Gene in the ON state either switches OFF (k2), or makes a transcript with constant probability (ktrans). Can result in transcriptional bursting (burst size b ~ ktrans / k2) Golding & Cox, Curr. Biol. (2006).
Simulation 2-state model reproduces experimental results: (analytical results, simulations) Experiment P0(t)declines with ratek1 mRNA number histogram Measured transcription rate k1eff = k1 * b s2/n 1+b Thattai and van Oudenaarden 2001;Paulsson 2004
RNA kinetics in individual cells # mRNA vs time Distribution of on & off times Distribution of burst sizes RNA bursts geometrically distributed On & off times exponentially distributed
Transcriptional bursting in eukaryotes Chubb JR, Trcek T, Shenoy SM, Singer RH. Curr. Biol. 2006 May 23;16(10):1018-25. See also: Golding & Cox, Curr. Biol. (2006).
Protein bursting in E. coli Yu J, Xiao J, Ren X, Lao K, Xie XS Science. 2006 Mar 17;311(5767):1600-3. Cai L, Friedman N, Xie XS Nature. 2006 Mar 16;440(7082):358-62. See also: Golding & Cox, Genome Biology (2006).
Additional findings: RNA partitioning DN = difference in RNA numbers between 2 daughter cells. Binomial statistics - consistent with independent segregation of individual molecules.
1) Protein copy number is proportional to mRNA copy number 2) How many proteins are made from one transcript? IG = (nRNA*N) * fGFP IR= nPROTEIN* fRFP IG = green fluorescence level (of spots) IR = red fluorescence level (of cell) fGFP = flux from one GFP molecule fRFP = flux from one RFP molecule N ~ 50-100, IR / IG = 3.10.2 fRFP /fGFP 31 p = nPROTEIN / nRNA= N * (fGFP /fRFP ) * (IR / IG) 60-110 protein vs mRNA slope1 RNA translation + single cells: protein/RNA correlations
Single molecule dynamics: mRNA chain elongation • Measured elongation rate ~ 15 nm/s ~ 25 nt/s • Consistent with: • bulk measurements (Ryals et al 1982) • our fluorescence measurement in single cells (~ 1 transcript/2.5 min) Golding and Cox, PNAS (2004)
x(t) y(t) Single molecule dynamics: Motion in the cytoplasm Particle tracking: constrained motion punctuated by large jumps Golding & Cox, Phys. Rev. Lett. (2006)
a=1 (in vitro) a=0.7 (in vivo) slope = -(1+a) = -1.77 original trajectories slope = -1.96 randomized trajectories Single molecule dynamics: Motion in the cytoplasm Motion is sub-diffusive: d2 = a ta , a = 0.70±0.07 (in vitro: a = 1.04 ±0.03) Similar motion observed in eukaryotic cells (lipid granules, dextran etc) Power spectrum of position: P(f) ~ f -(1+a) , a = 0.77±0.03 Sub-diffusion arising from long-tailed distribution of waiting times: w(t) ~ t-(1+a)with 0 < a< 1 (Metzler & Klafter 2000) Interaction with heterogeneous medium
What hinders motion in the cytoplasm? • Cytoskeleton? • Polymer network spanning the cell. • In bacteria: MreB, FtsZ, ParM etc. • (Errington 2003) • * Motion in actin networks in-vitro • is sub-diffusive • (Amblard et al 1996, Wong et al 2004) http://35.9.122.184/images/07-TourOfTheCell/HTML/source/46.html * However: MreB & FtsZ mutants exhibit sub-diffusion similar to wild-type (“Mixed” results in eukaryotes: Weiss et al 2004, Tolic-Norrelykke et al 2004, Dauty and Verkman 2005)
(2) Molecular crowding? Large volume fraction of cell taken by macromolecules: ~300 mg/ml (Zimmerman & Trach 1991) ~20000 ribosomes/cell ~1 mm DNA http://www.jbc.org/content/vol276/issue14/images/large/bc1411813001.jpeg What hinders motion in the cytoplasm? * Sub-diffusion coefficient decreases with growth rate * Deleting RBS leads to faster motion * In vitro results (Banks and Fradin 2005) * Monte-Carlo simulations (Saxton 1994, Weiss et al 2004)
What hinders motion in the cytoplasm? Exponent a is insensitive to system parameters: presence of RBS, length of RNA molecule, growth rate, presence of antibiotics (Cm,Tet), cytoskeletal elements (MreB,FtsZ)… • Possible scenario: a =al +(1-al)e-f/f0 (Banks & Fradin 2005) • =sub-diffusion exponent F0 =threshold density for S.D. = ? al =asymptotic value of a ≈ 0.74 Values for E. coli : F* ≈ 0.4 (Zimmerman & Trach 1991) a*≈ 0.74 (this study) Possible implications… E. coli : F* >> F0 a*≈ al F0=0.1 (F* , a*) al F0=0.05 * obstacle density
Possible consequences:How do transcription factors find their target? • 3D diffusion is inefficient; 3D+1D is postulated (von Hippel & Berg 1989). • TFs are often produced close to their target (Warren & ten Wolde 2004). • Probability of finding target before escaping: p ~ (a/r)3-2/a (p→1 for a →2/3) where a = target size, r = initial distance (Golding & Cox 2006, Halford & Marko 2004).
uninfected infected with phage l lysogens lysis Current & future work • Mechanisms of transcriptional bursting • Reporters for other promoters: phage l genetic switch • Combine with other cellular markers: DNA, RNAP, ribosomes, cytoskeleton… • Kinetics of cellular events: phage infection
Thanks to: D. Peabody, H. Diamant, R. Segev, Y. Zhang, R. Austin, P. Wolanin, J. Puchalla & all members of the Cox lab Johan Paulsson Ted Cox